Viewing System Log
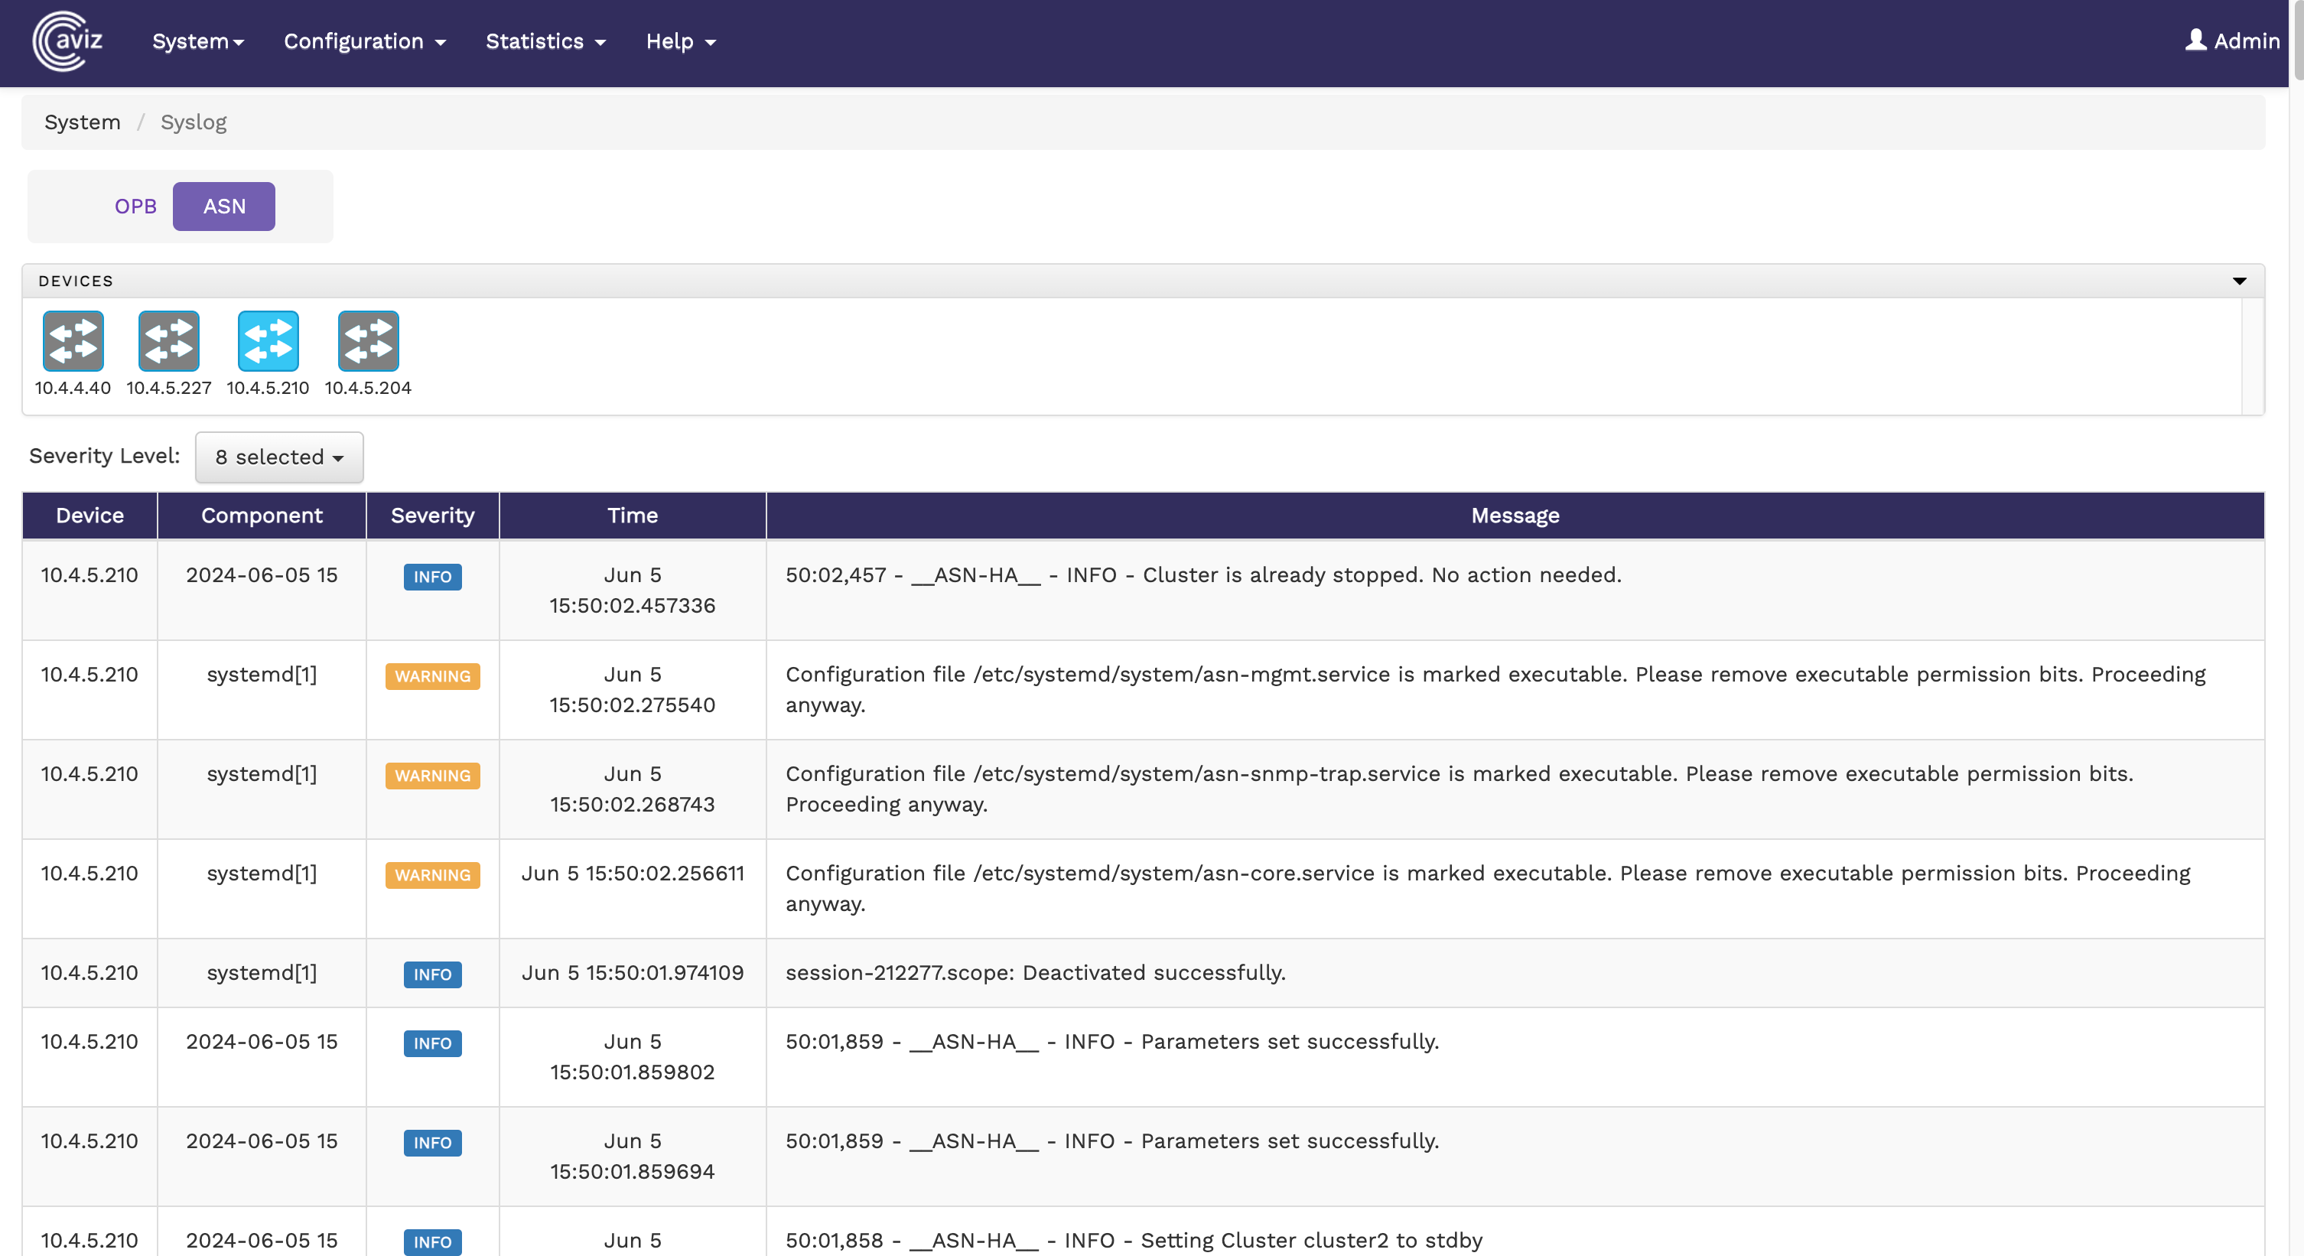
To view the system log from the FlowVision GUI, click System > Syslog.

The Syslog page shows the system logs of all the nodes that are online. You can click the device icon for each of the online devices to get the system log for that particular device. The system log shows the device IP, component, severity level, time stamp, and the severity level message with more specific information.
The following image shows the system log table of a device:

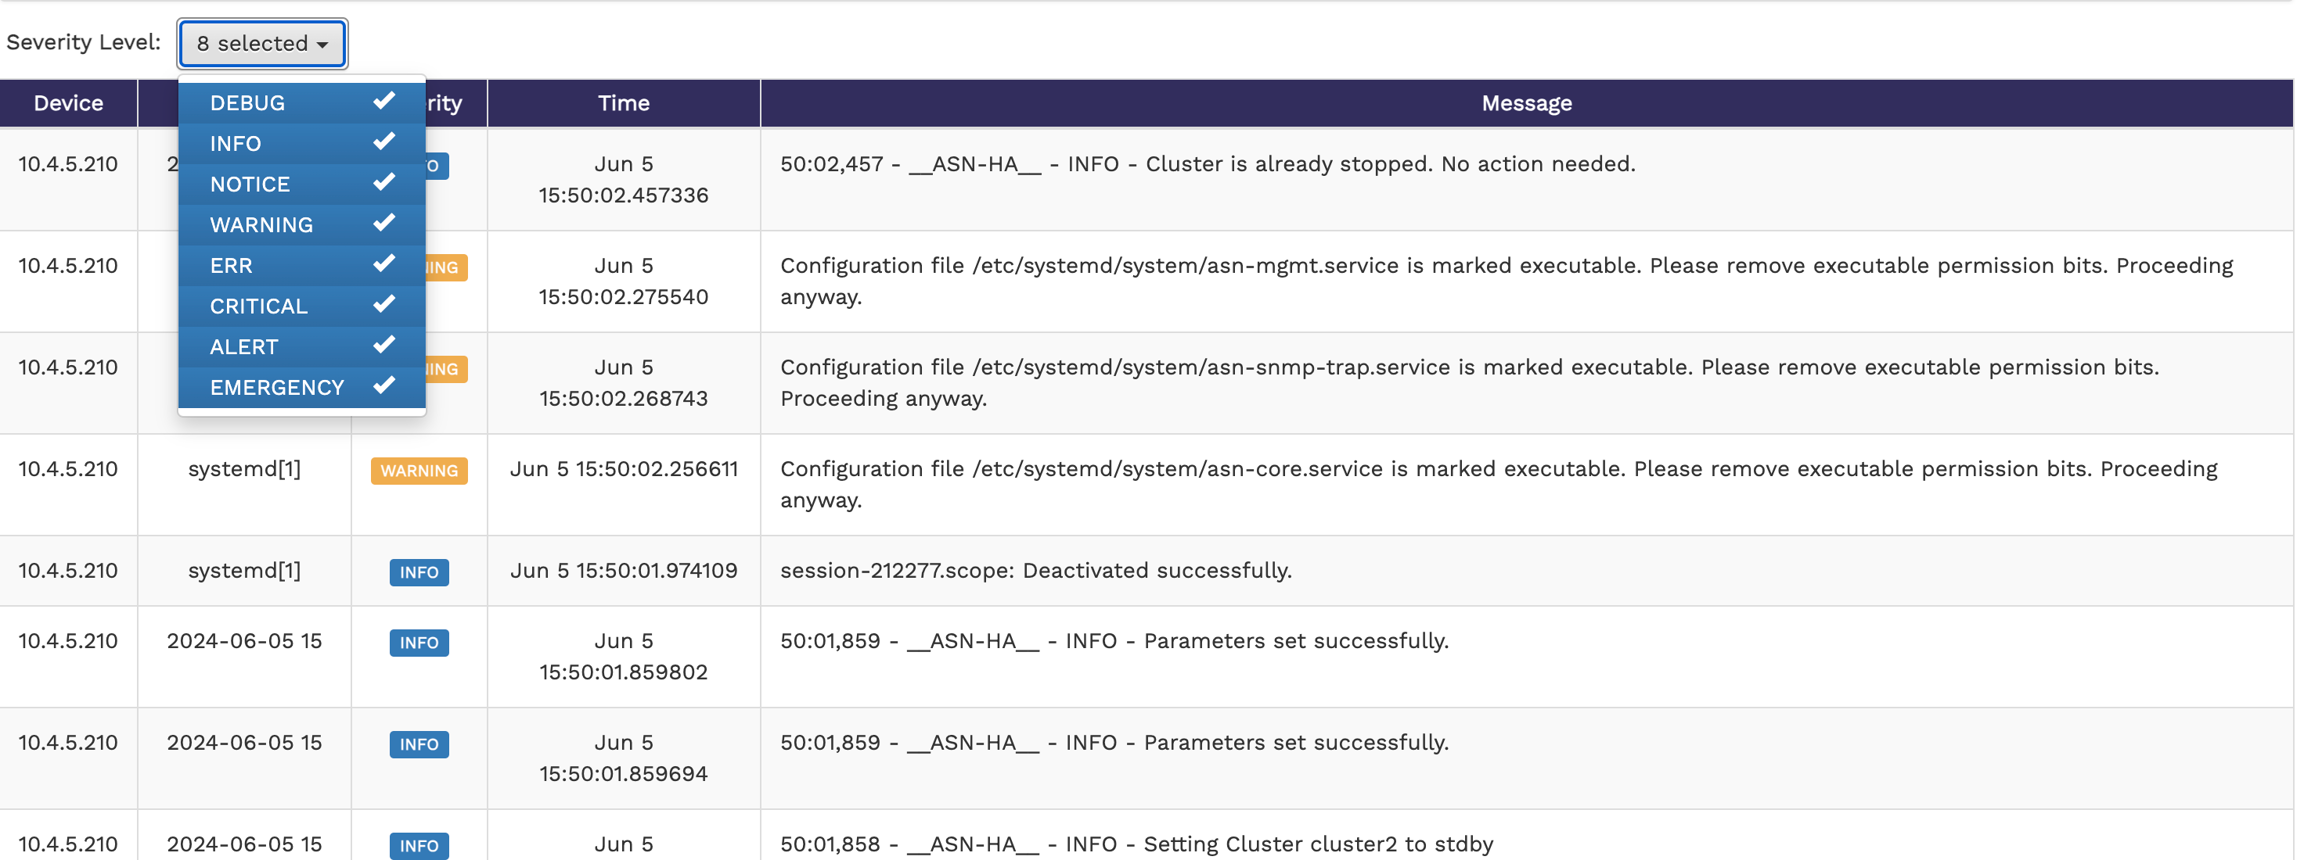
You can change the severity level of the messages displayed in the syslog table using the Severity Level drop-down menu. The available options are Debug, Info, Notice, Warning, Err, Critical, Alert, and Emergency. This is a multi-select menu where you can select multiple severity levels to be displayed.
