Viewing Ports Statistics
To view the port statistics of the connected devices from the FlowVision GUI, click Statistics >ASN> Ports.
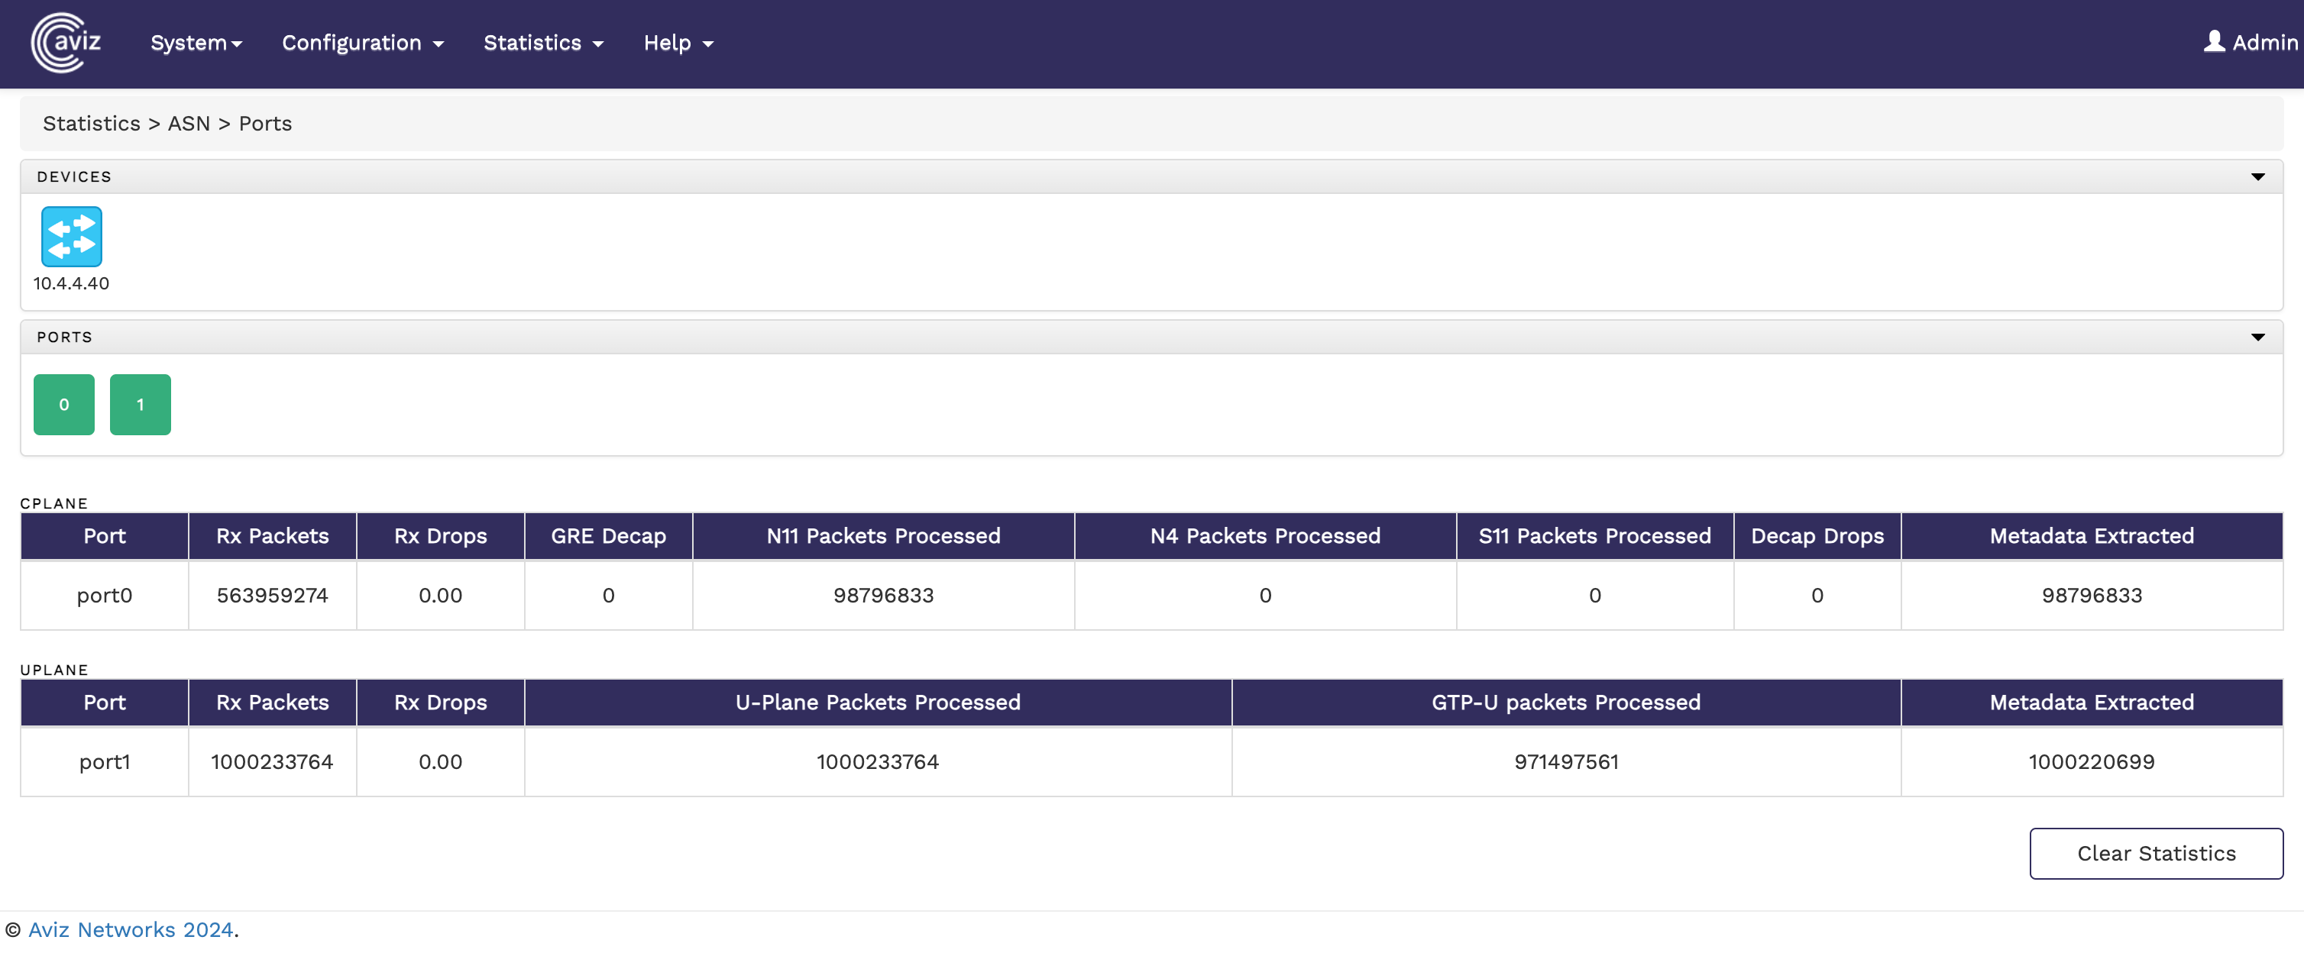
The Ports statistics page shows you the connected Nodes, the available ports on each Node, and the counters. By default, when you select a device the statistics for all the ports in the device are displayed. If you want to get the statistics of a particular port, select the port from the list of ports.
The following image shows the ASN port statistics page:

CPLANE
Port: The name of the port.
Rx Packets: The number of received packets.
Rx Drop: The percentage of packets dropped.
GRE Decap: The number of GRE packets decapsulated.
N11 Packets Processed: The number of N11 packets received.
N4 packets Processed: The number of N4 packets received.
S11 Packets processed: The number of S1-U packets received.
Decap Drops: The number of packets dropped due to decapsulation error.
Metadata Extracted: The number of packets from which metadata has been extracted.
UPLANE
Port: The name of the port.
Rx Packets: The number of received packets.
Rx Drops: The percentage of received packets dropped.
U-Plane Packet Processed: The number of U-Plane packets received.
GTP-U Packet Processed: The number of GTP-U packets received.
Metadata Extracted: The number of packets from which metadata has been extracted.
