Loading...
Loading...
Loading...
Loading...
Loading...
Loading...
Loading...
Loading...
Loading...
Loading...
Loading...
Loading...
Loading...
Loading...
Loading...
Loading...
Loading...
Loading...
Loading...
Loading...
Loading...
Loading...
Loading...
Loading...
Loading...
Loading...
Loading...
Loading...
Loading...
Loading...
Loading...
Loading...
Loading...
Loading...
Loading...
Loading...
Loading...
Loading...
Loading...
Loading...
Loading...
Loading...
Loading...
Loading...
Loading...
Loading...
Loading...
Loading...
Loading...
Loading...
Loading...
Loading...
Loading...
Loading...
Loading...
Loading...
Loading...
Loading...
Loading...
Loading...
Loading...
Loading...
Loading...
Loading...
Loading...
The FlowVision Controller can be installed using the following methods:
ASN_SUBSCRIBER_PERFORMANCE
2x 10G (1U 1C) X710
92
184G
Gen3
1TB
ASN_APPLICATION_BASIC
2x 10G (2U) X710
48
64GB
Gen3
1TB
ASN_APPLICATION_ADVANCED
2x 10G (2U) X710
64
108GB
Gen3
1TB
ASN_APPLICATION_PERFROMANCE
2x 10G (2U) X710
92
156G
Gen3
1TB
ASN_SUBSCRIBER_BASIC
2x 25G (1U 1C) E810, NVIDIA CX6/7/8
100
128GB
Gen4
2TB
ASN_SUBSCRIBER_ADVANCED
2x 25G (1U 1C) E810, NVIDIA CX6/7/8
150
192GB
Gen4
2TB
ASN_SUBSCRIBER_PERFORMANCE
2x 25G (1U 1C) E810, NVIDIA CX6/7/8
256
300GB
Gen4
2TB
ASN_APPLICATION_BASIC
2x 25G (2U) E810, NVIDIA CX6/7/8
100
128GB
Gen4
2TB
ASN_APPLICATION_ADVANCED
2x 25G (2U) E810, NVIDIA CX6/7/8
150
192GB
Gen4
2TB
ASN_APPLICATION_PERFROMANCE
2x 25G (2U) E810, NVIDIA CX6/7/8
256
300GB
Gen4
2TB
ASN_SUBSCRIBER_BASIC
4x 25G (3U 1C) E810, NVIDIA CX6/7/8
150
256GB
Gen4
3TB
ASN_SUBSCRIBER_ADVANCED
4x 25G (3U 1C) E810, NVIDIA CX6/7/8
256
300GB
Gen4
3TB
ASN_SUBSCRIBER_PERFORMANCE
4x 25G (3U 1C) E810, NVIDIA CX6/7/8
300
360GB
Gen4
3TB
ASN_APPLICATION_BASIC
4x 25G (4U) E810, NVIDIA CX6/7/8
150
256GB
Gen4
3TB
ASN_APPLICATION_ADVANCED
4x 25G (4 U) E810, NVIDIA CX6/7/8
256
300GB
Gen4
3TB
ASN_APPLICATION_PERFROMANCE
4x 25G (4 U) E810, NVIDIA CX6/7/8
300
360GB
Gen4
3TB
ASN_SUBSCRIBER_BASIC
2x100G (1U and 1C) Intel E810, NVIDIA CX6/7/8
150
256GB
Gen4
6TB
ASN_SUBSCRIBER_ADVANCED
2x100G (1U and 1C) Intel E810, NVIDIA CX6/7/8
256
300GB
Gen4
6TB
ASN_SUBSCRIBER_PERFORMANCE
2x100G (1U and 1C) Intel E810, NVIDIA CX6/7/8
300
360Gb
Gen4
6TB
ASN_APPLICATION_BASIC
2x100G (2U) Intel E810, NVIDIA CX6/7/8
150
256Gb
Gen4
6TB
ASN_APPLICATION_ADVANCED
2x100G (2U) Intel E810, NVIDIA CX6/7/8
256
300GB
Gen4
6TB
ASN_APPLICATION_PERFROMANCE
2x100G (2U) Intel E810, NVIDIA CX6/7/8
300
360GB
Gen4
6TB
ASN_SUBSCRIBER_BASIC
4x100G(3U + 1C) Intel E810, NVIDIA CX6/7/8
150
256GB
Gen4
12TB
ASN_SUBSCRIBER_ADVANCED
4x100G(3U + 1C) Intel E810, NVIDIA CX6/7/8
256
300GB
Gen4
12TB
ASN_SUBSCRIBER_PERFORMANCE
4x100G(3U + 1C) Intel E810, NVIDIA CX6/7/8
300
360GB
Gen4
12TB
ASN_APPLICATION_BASIC
4x100G (4U - 50G each) Intel E810, NVIDIA CX6/7/8
150
256GB
Gen4
12TB
ASN_APPLICATION_ADVANCED
4x100G (4U - 50G each) Intel E810, NVIDIA CX6/7/8
256
300GB
Gen4
12TB
ASN_APPLICATION_PERFROMANCE
4x100G (4U - 50G each) Intel E810, NVIDIA CX6/7/8
300
360GB
Gen4
12TB
ASN_SUBSCRIBER_BASIC
2x 10G (1U 1C) X710
48
72GB
Gen3
1TB
ASN_SUBSCRIBER_ADVANCED
2x 10G (1U 1C) X710
64
128G
Gen3
1TB
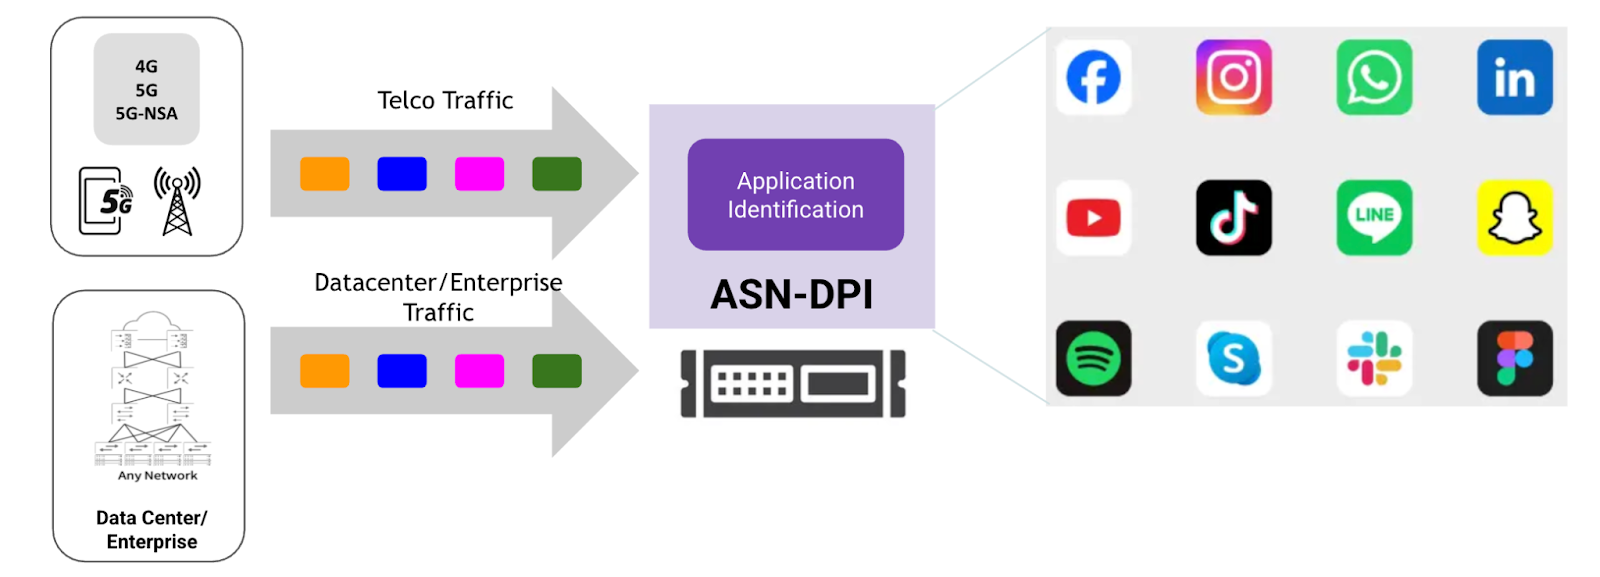
The ASN platform supports advanced packet analysis, KPI monitoring, and traffic visibility for both Telecom (GTP-based) and Data Center (IP-based) deployments. It provides DPI (Deep Packet Inspection)
Please refer to the following links for downloading ASN Package & FlowVision :
You are required to sign-up on for getting access to the download page.
Latency and bandwidth utilization measured with 5-second granularity and Real-time analytics for network monitoring and SLA enforcement.
In both Telco and IP network domains, maintaining consistent application performance depends heavily on understanding packet delivery reliability and latency behavior across dynamic network segments. Whether in a 5G Core, Data Center (DC), or FTTH aggregation network, Aviz Service Node delivers precise KPI measurements for TCP Packet Loss and TCP–UDP Jitter — enabling end-to-end insight into real user experience. These metrics are critical for engineers troubleshooting throughput degradation, latency spikes, or congestion-related impairments that traditional flow counters often fail to expose.
Aviz Service Node computes TCP Packet Loss by passively analyzing mirrored traffic flows at the packet level. It tracks TCP sequence numbers, retransmissions, and acknowledgment gaps to accurately determine the volume and rate of lost packets. The analysis is performed per flow and correlated with user session metadata such as IP addresses, VLANs, QoS tags, and tunnel identifiers (e.g., GTP in Telco or VXLAN/GRE in IP networks). This cross-domain correlation allows engineers to pinpoint where in the path — between RAN and Core, or between leaf-spine nodes in a DC fabric — the loss originates. Similarly, TCP–UDP Jitter is computed by evaluating inter-packet timestamp variations, providing real-time insight into delay fluctuations for both connection-oriented (TCP) and connectionless (UDP) traffic streams.
KPI insights, IP information, GTP session details, and application payload analysis
As mobile operators continue to transition between 4G and 5G, one of the biggest operational challenges is maintaining consistent Control Plane visibility when subscribers move across Radio Access Technologies (RATs). The Aviz Service Node bridges this visibility gap. Acting as a passive, observability-driven mediation layer, it maintains continuous and correlated session tracking across EPC and 5GC interfaces — enabling seamless 4G ↔ 5G handover insights without any change to the live network configuration.
Aviz Service Node automatically detects handovers between EPC and 5GC through IMSI-based session matching and performs an in-place session upgrade logic — maintaining a unified view of the subscriber session throughout the transition. During each transition, ASN dynamically updates metadata exports to Kafka, reflecting real-time field updates such as RAT type, user type, IP, and TEIDs — ensuring analytics and monitoring systems always have synchronized, current session data.
2 vCores
4 GB RAM
20 GB HDD
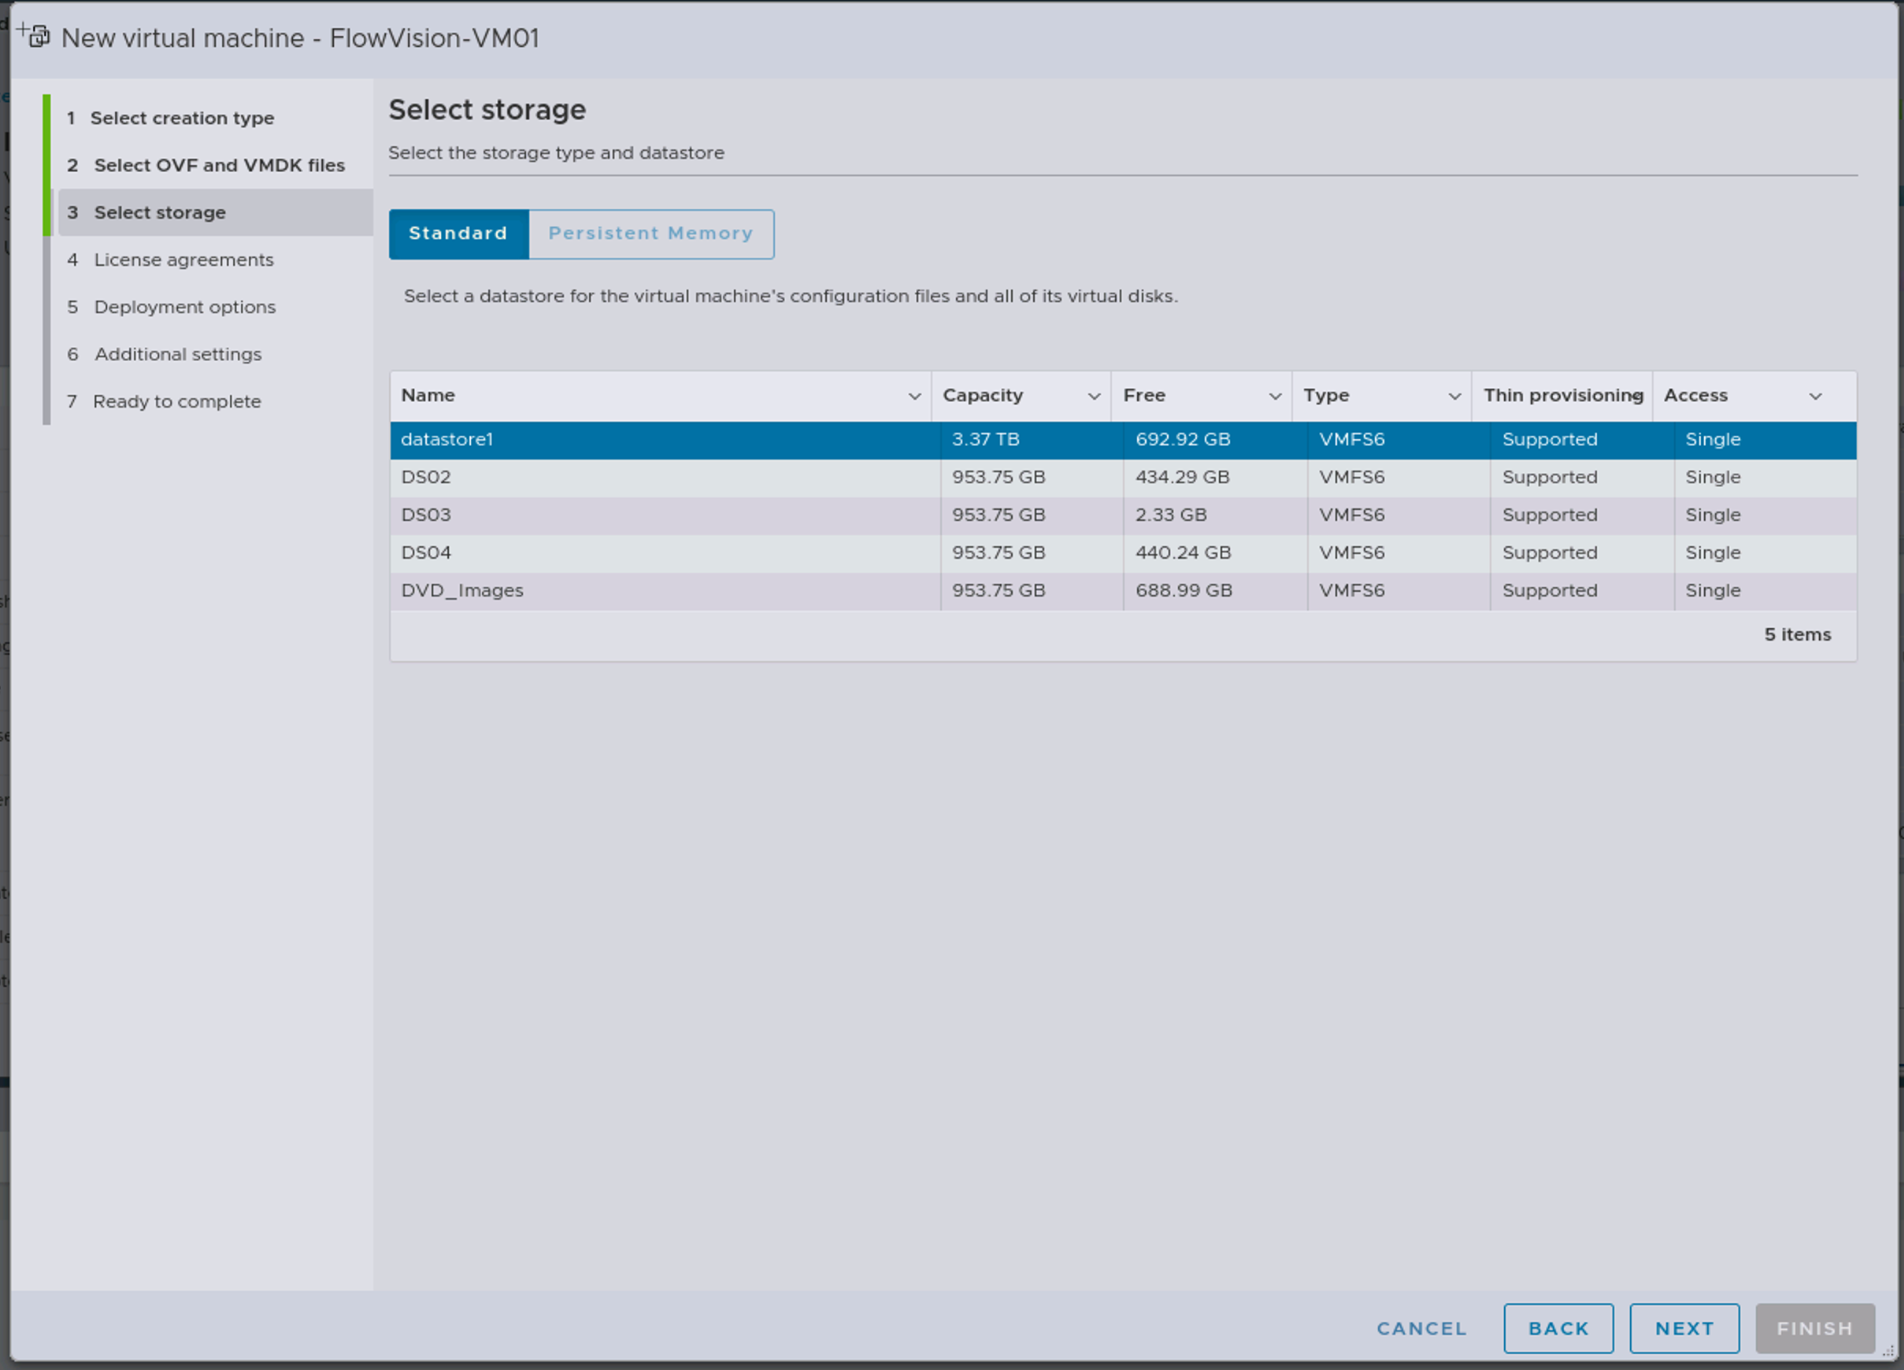
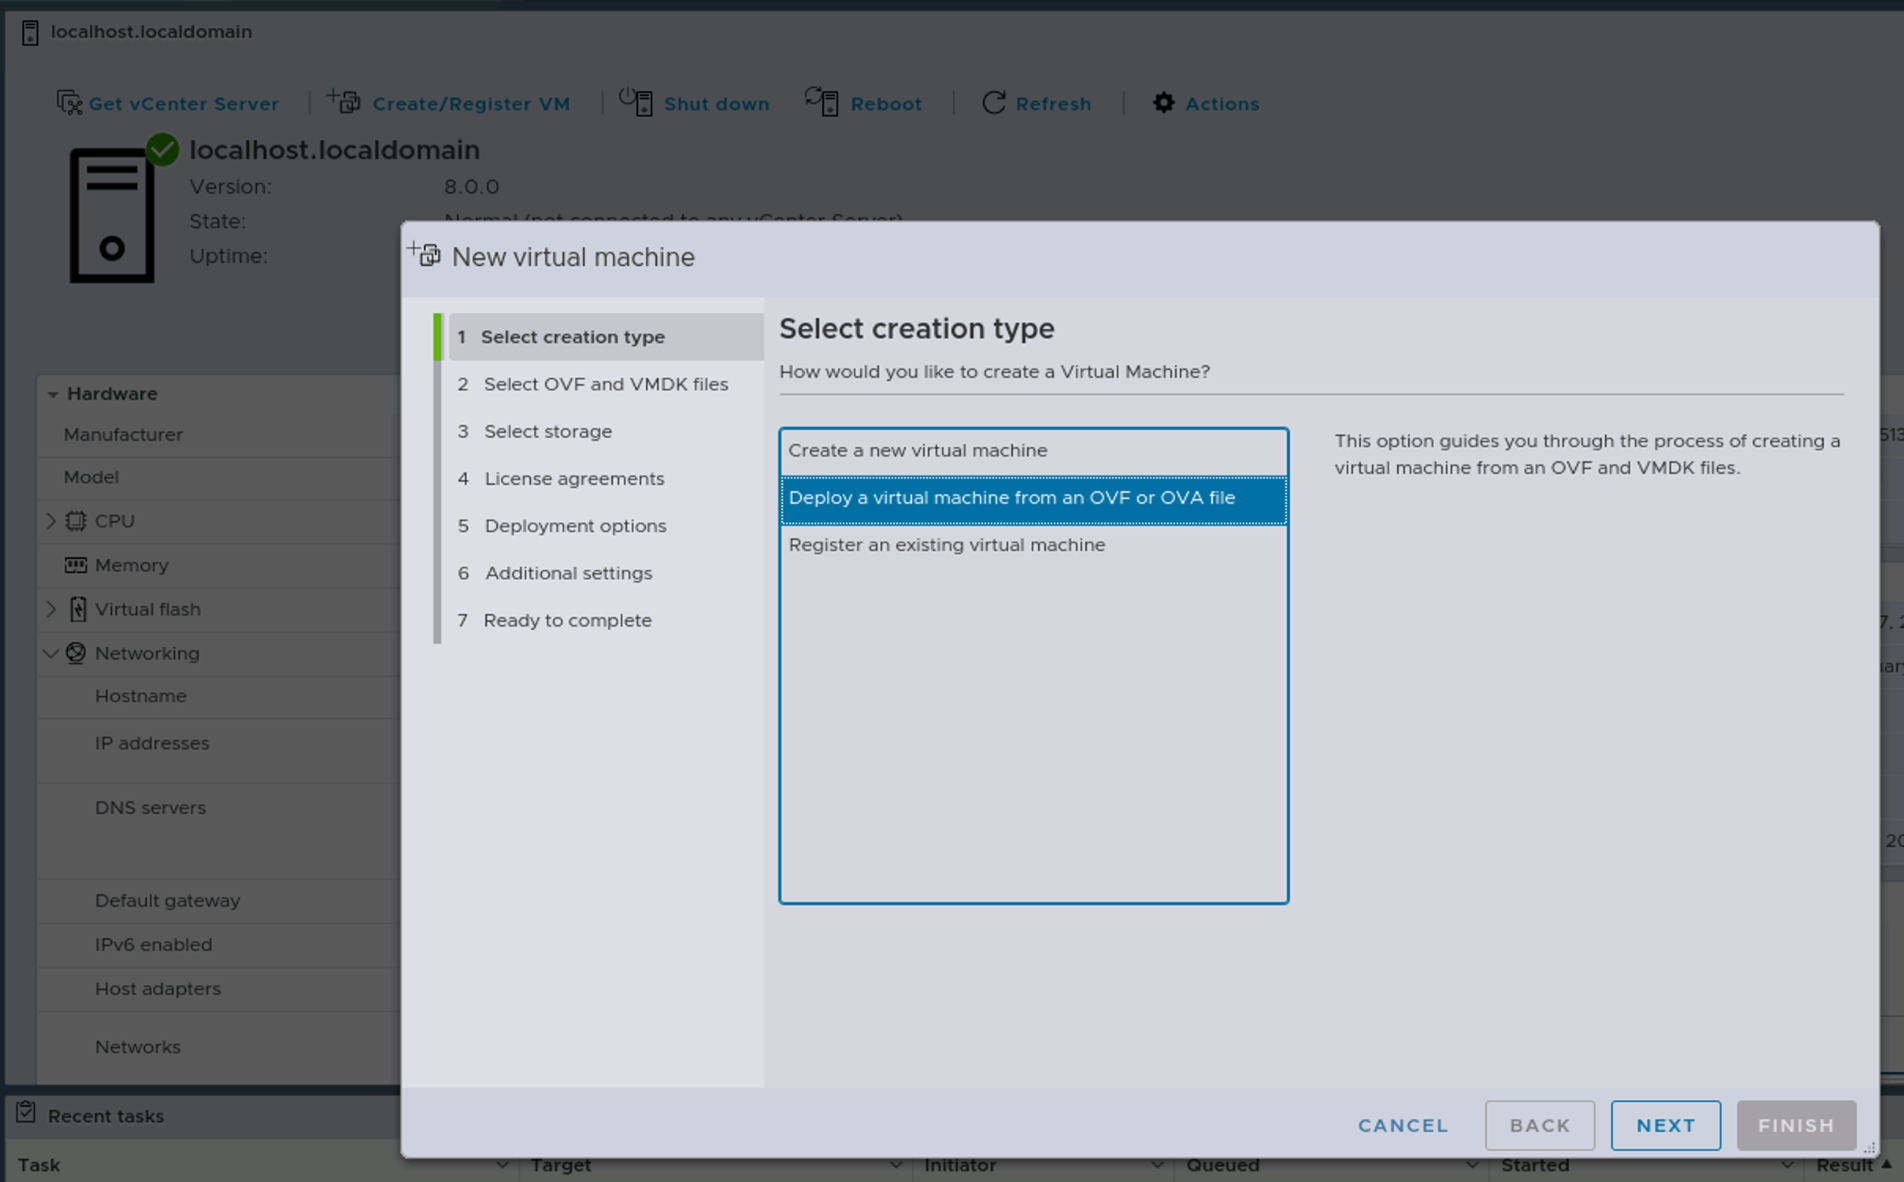
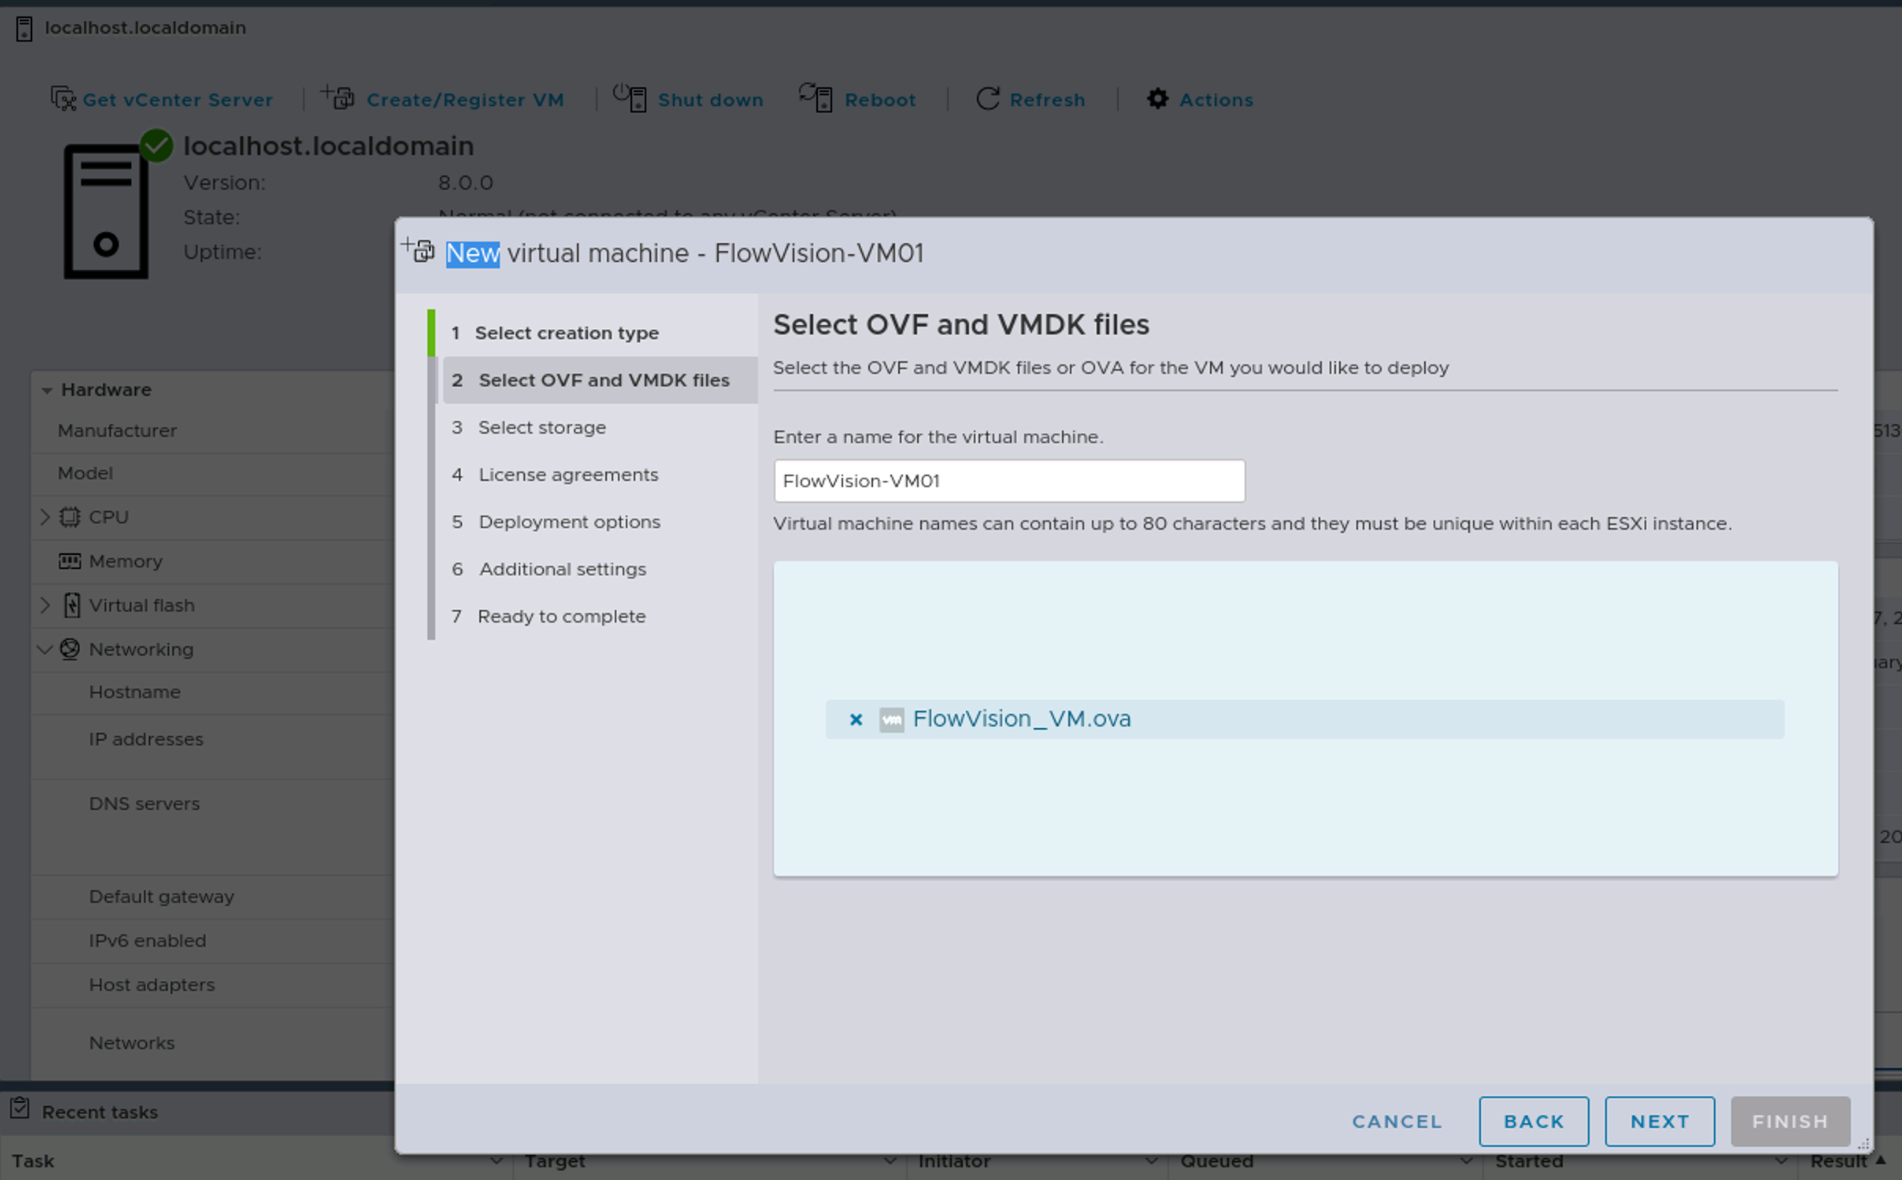
Log in to the ESXi Host and click on 'Create/Register VM'
Click on 'Deploy a virtual machine from an OVF or OVA file'
Name the VM and select the downloaded 'OVA' file
Choose the 'datastore' where you want to install the VM
Select the 'VM-Network' to ensure that the VM is reachable
Review the configuration and click on 'FINISH'
Wait for the OVA file to upload; Check the status in 'Recent tasks' at the bottom of the screen
'Power on' the VM
Login to the VM with default credentials
User: aviz
Password: Aviz@123
Verify the DHCP-assigned IP on the VM using the command: ip a.
Login to the Web-GUI at https://<VM-IP>/ with default credentials
User: admin
Password: admin
cp-kafka:7.9.4
cp-kafka-connect:7.9.4
elasticsearch:8.11.1
kibana:8.11.1
Extract the package tar -xvf asn-viz-packages.tar.gz
Change to the extracted directory cd asn-viz/
Execute the asn package script : sudo ./run-asn-viz.sh
Open the Kibana URL displayed at the end of installation.
Log in using the credentials provided.
Navigate to the Dashboard section to view the ASN data visualizations.
Credentials are displayed at the end of installation.
The visualization stack is deployed after the standard ASN installation. The installation script performs these key functions:
Deploys Elasticsearch, Kibana, and Kafka Connect using Docker Compose.
Configures security settings with password authentication.
Sets up connectivity between components.
Enables secure authentication for Elasticsearch.
Creates and manages access credentials.
Configures Kibana to authenticate with Elasticsearch.
Connects Kafka topics to Elasticsearch indices.
Configures data transformation for visualization.
Imports pre-configured dashboards into Kibana.
The `run-asn-viz.sh` script performs the following steps:
Validates the presence of required files.
Detects the system IP address for proper configuration.
Updates Docker Compose configuration (with system ip).
Extracts and installs the Kafka-Elasticsearch connector in the /etc directory.
Starts the visualization stack containers in the correct order (zookeper > kafka > all containers).
Sets up secure passwords for Elasticsearch users (uses elastic search reset commands to generate passwords).
Configures Kibana to use these credentials (updates required .yml file in the kibana container).
Updates the Kafka-Elasticsearch connector configuration (IP changes to system ip in the conn script along with the authentication details before calling the curl commands).
Imports the pre-configured dashboard (uses curl command to save object in the Stack Management of kibana).
Outputs access information including URLs and credentials.
Execute “sudo docker compose down” and execute the install script, this is the case where already the containers are up and installation script needs to be executed
Steps to check docker status if its already running,
sudo docker ps -a
sudo docker stop $(sudo docker ps -q)
sudo docker compose rm
sudo docker rm $(sudo docker ps -aq)
sudo docker ps -a
If dashboard import fails during installation, manually import using the command shown at the end of installation output.
Ensure all services are running with `sudo docker ps`.
Verify the credentials in the Kibana configuration. It is suggested to use the elastic user and the corresponding password to login to the kibana
Kafka topics → Kafka Connect → Elasticsearch → Kibana
This integration enhances the ASN platform with visualization capabilities while maintaining a simple shell script based deployment process.
Open the Kibana URL displayed at the end of installation.
Log in using the credentials provided.
Navigate to the Dashboard section to view the ASN data visualizations
ASN-RADIUS-DASHBOARD
ASN-TELCO-UPLANE-Dashboard
ASN-TELCO-CONTROL
Open the kafka UI URL displayed at the end of installation
Navigate to the Topics section and click on the overview to get kafka statistics information
Credentials are displayed at the end of installation.
Open the Kibana URL displayed at the end of installation.
Log in using the credentials provided.
Navigate to the Dashboard section to view the ASN data visualizations.
Open the kafka UI URL displayed at the end of installation
Navigate to the Topics section and click on the overview to get kafka statistics information
Note - Existing dashboard ASN-DC-FTTH-Dashboard will be replaced
2 vCores (available for FlowVision VM)
8 GB RAM
40 GB HDD
Download Oracle VM virtual box from the below link
Install Oracle VM Virtual box
Import the OVA file in Oracle VM virtual box
Click the start button to power-on the virtual machine
Log in to the FlowVision VM with default credentials
Username: aviz
Password: Aviz@123
Get the IP address of the VM through ip address show
Access the GUI through the above IP using your favourite browser with http port: 8093
https://<VM_IP>:8093/
Login to the GUI with the default credentials
Username: admin
Password: admin
Means capturing, decoding, and mapping control-plane signaling (GTP-C) to corresponding user-plane traffic (GTP-U) to analyze or troubleshoot subscriber sessions in the 5G Non-Standalone network..
Extraction means capturing and decoding GTP-C and GTP-U packets from live traffic or PCAP traces.
Correlation is the process of linking GTP-C (control-plane) messages with their corresponding GTP-U (user-plane) flows.The correlation between GTP-C and GTP-U is essential for ensuring seamless communication and data integrity in a 5G NSA architecture. By analyzing both control and user plane packets, it becomes possible to troubleshoot issues related to session management and data flow effectively.
GTP-C Handling
GTP-C Handling refers to how a network element (NE) — such as an MME, SGW, PGW, SMF, or UPF — processes, manages, and responds to GTP-C (GPRS Tunneling Protocol–Control) messages.
GTP-U Handling
GTP-U Handling refers to how a network element (NE) — such as SGW, PGW, or eNodeB processes, encapsulates, forwards, and decapsulates GTP-U packets in the user plane.
Essentially, it’s the end-to-end management of data flow through GTP tunnels.
Control Plane - GTP-C processing is done on S11 Interface between MME(Mobile Management Entity) and SGW (Service Gateway)
User Plane - GTP-U processing is done on S1-U Interface between SGW and eNodeB (Base Station)
Metadata extraction is done on both GTP-C and GTP-U Packets.
Control Plane - processing is done on S5/S8-C Interface between SGW-C and PGW–C
User Plane - GTP-U processing is done on S5/S8-U Interface between SGW-U and PGW-U
Metadata extraction is done on both GTP-C and GTP-U Packets.
This section provides information about how to install/upgrade the ASN.
ASN 2.3 introduces key enhancements including Active bearer support, Unique identifiers for kafka exports, DSCP IP TOS extraction support, User session flow visibility on control sessions, Radius session info on control sessions, PRIO Cause attribute on control session data for Delete Session request or Delete Bearer request, Rule base attribute to RADIUS session data, Boot configuration support in FV for Telco and DC environments. The release also includes SIP-RTP support, Intel & ConnectX NIC combination support. The enhanced DPI dynamic upgrade, Config TX options & unique packet stats in dedup, Boot option for Dedup only and to skip metadata extraction in FV, memory optimisations, critical bug fixes, and retains all features from ASN 2.2 with improved stability and performance.
Key Features & Enhancements:
Active bearer support: Aviz Service Node provides user based Active Bearer export for subscriber sessions in 4G-EPC/5G-NSA networks
Unique identifiers for kafka exports: Aviz Service Node is improved to export data with a unique key—configurable via Flow Vision (FV) or defaulting to hostname—enabling improved end-to-end monitoring of control and user session subscriber information.Also unique id is to find the right ASN which is exporting the data out of Multiple ASNs in the network.
DSCP IP TOS extraction support: Aviz Service Node now supports extraction of both inner and outer IP header DSCP (IP TOS) attributes for Telco and Enterprise environments.
User Session flow visibility on control sessions: Aviz Service Nodes provide the consolidated User session creation, termination stats per control session export.
Radius correlation on control sessions: Aviz Service Nodes include RADIUS-related subscriber information directly in control session data for 4G-EPC/5G-NSA networks.
PRIO Cause on control session for Delete Session or Delete Bearer request: Aviz Service Nodes now categorize session deletions with the PRIO Cause attribute in control session data for Delete Session Request and Delete Bearer Request packets.
Rule base attribute to RADIUS session data: Aviz Service Nodes support in-depth extraction of Rulebase attribute payloads from RADIUS protocol packets.This enables precise policy enforcement visibility, improves subscriber authorization tracking, and helps operators validate rule-based access decisions for troubleshooting, auditing, and compliance.
: Aviz Service Nodes enable Boot configuration via Flow Vision for in-service provisioning in both Telco and Enterprise deployments..
: Aviz Service Nodes support extraction of SIP and RTP protocol data (including audio, voice, and media formats) along with Call-ID based information and correlations.
Aviz Service Nodes feature an advanced DPI engine for deep, accurate traffic analysis, including examination of packets with various payloads and targeted metadata extraction
Intel and ConnectX NiC combined support: Aviz Service Nodes support multi-NIC configurations using Intel, ConnectX, or both simultaneously for control and user planes (and vice versa) in Telco and Enterprise environments..
Dynamic DPI Upgrade from FV: Aviz Service Nodes allow in-service dynamic DPI upgrades through Flow Vision.
Aviz Service Nodes is optimized for Dedup Tx configuration options and Packet statistics for Enterprise environments through Flow Vision.
Dedup-Only Boot Option: Aviz Service Nodes can be configured with Deduplication-only support via a Dedup-Only boot option in Flow Vision for enhanced performance..
Metadata Export skip Boot Option: Aviz Service Nodes support disabling Metadata Export for application payload data through boot options in Flow Vision
Enabling ASN on RHEL: Aviz Service Nodes can now be installed on Red Hat Enterprise Linux.
ASN VIZ Package: Aviz Service Nodes support offline package installation with Kibana dashboard for Telco and DC modes.
ASN 2.2 introduces key enhancements including Cplane Handover and switching, KPI Packet loss and Jitter for Telco and DC environments. The release also includes ASN DPU, ConnectX, enhanced DPI, memory optimisations, critical bug fixes, and retains all features from ASN 2.1 with improved stability and performance.
Key Features & Enhancements
Cplane Handover/Switching: Aviz Service Node ensures smooth subscriber session continuity when users move between 4G (EPC) and 5G (Core) networks
KPI - Packet Loss and Jitter: Aviz Service Node delivers precise KPI measurements for TCP Packet Loss and TCP–UDP Jitter enabling end-to-end insight into real user experience
ASN on NVIDIA BlueField-3 DPU: Aviz Service Node on NVIDIA BlueField-3 DPU delivers standalone Subscriber-Aware Load Balancing (SALB), leveraging P4 programmable datapath to achieve peak 400 Gbps performance
ASN 2.1 introduces key enhancements including control session timeout support, active bandwidth KPIs, and advanced observability packaging for Telco and DC environments. It supports flexible mode switching (TELCO ⇄ DC), improved App ID detection, and RADIUS Flex Export. The release also includes memory optimizations, critical bug fixes, and retains all features from ASN 2.0 with improved stability and performance.
Key Features & Enhancements
- This feature enables automatic timeout handling for inactive control-plane sessions, helping to free up system resources and maintain performance in long-running deployments. It allows the system to detect and clean up sessions that have exceeded a defined inactivity period, improving session lifecycle management and resource efficiency.
- This feature introduces a new KPI to measure the active bandwidth usage of control-plane sessions. It enables real-time monitoring of data transmission rates during session activity, helping operators track usage patterns, detect anomalies, and optimize resource allocation. This KPI enhances observability and supports detailed traffic analysis per session.
The ASN R2.0 release brings enterprise-ready enhancements and telco-grade capabilities, making it the most powerful and scalable version yet. With a focus on advanced traffic processing, deep packet inspection, and seamless packet capture, this release enables real-time network intelligence and improved operational efficiency.
Key Highlights of ASN R2.0
Enterprise & Telco Ready – ASN R2.0 ensures seamless deployment across both enterprise and high-capacity telco environments. Whether managing large-scale enterprise infrastructure or a high-traffic telecom network, its enhanced scalability and efficiency make deployment smooth and reliable.
– The new packet deduplication feature eliminates redundant L2, L3, and L4 packets, optimizing data flow and reducing unnecessary processing overhead.
Next-Generation Application Identification with Advanced DPI – Gaining deep visibility into network traffic is more critical than ever. With advanced Deep Packet Inspection (DPI) for IP packets
The ASN R2.1.0 is supported on FlowVision R4.1.0.
Aviz Service Node (ASN) is a high-performance, software-defined solution for network visibility, real-time packet processing, and metadata extraction across telecom, enterprise, data center, FTTH, campus, and edge networks. It efficiently identifies applications, extracts HTTP metadata, captures DNS information, and enables deep traffic analysis.
Designed for scalability and high availability, ASN runs on general-purpose hardware, eliminating vendor lock-in while delivering high-speed packet filtering, flow processing, and intelligent data correlation. Whether deployed in core networks or distributed environments, ASN ensures efficient traffic monitoring, security enforcement, and performance optimization at any scale.
Network Packet Stack
The Aviz Network Packet Stack features advanced packet filtering, manipulation, and metadata export functions through the Aviz Service Node, enhancing network operations such as security and analytics.
Mobile Stack
The Mobile Stack from Aviz delivers comprehensive traffic inspection for mobile core networks. It features support for GTP control plane and user plane correlation across various network interfaces, optimizing mobile core deployments.
Application Stack
The Aviz Service Node Application Stack offers dynamic discovery and identification of traffic patterns and applications. It delivers a detailed overview of the applications operating within your network, their bandwidth usage, and their geographic locations. Additionally, the ASN furnishes enriched application metadata to facilitate integration with external customer and open source tools.
Explore these guides to set up and work with the Aviz Service Node.
Aviz Service Node (ASN) offers two types of licenses tailored for different network environments:
ASN Subscriber -Designed for telecom networks, including 4G LTE, 5G NSA, and 5G SA, enabling advanced traffic extraction, correlation, and subscriber-aware analytics.
ASN Application- Optimised for data centers, FTTH, edge, and campus networks, providing deep IP session management, application-level analytics, and advanced traffic visibility.
Configurable Metadata Extraction in ASN
From this page, you can enable or disable the following metadata extraction options on the Aviz Service Node (ASN) for 5G-NSA:
IMSI (International Mobile Subscriber Identity): A unique identifier for a mobile subscriber.
IMEI (International Mobile Equipment Identity): A unique identifier for a mobile device.
MSISDN (Mobile Station International Subscriber Directory Number): The phone number associated with the subscriber.
APN/DNN (Access Point Name / Data Network Name): Defines the network path for data connections.
USER TYPE: Classification of the user, typically indicating subscriber type or service level.
UE IP ADDR(User Equipment IP Address):The IP address assigned to the user's device.
CGI (Cell Global Identifier): A unique identifier for a cell in a mobile network.
SAI (Service Area Identifier): Identifies the service area within a network.
RAI (Routing Area Identifier): Specifies the routing area within a mobile network.
IPv4 Address Uplink (SGW): The IPv4 address for the uplink from the Serving Gateway (SGW).
IPv4 Address Downlink (eNodeB): The IPv4 address for the downlink to the eNodeB (Evolved Node B).
IPv6 Address Uplink (SGW): The IPv6 address for the uplink from the Serving Gateway (SGW).
Cplane Latency: The latency in the control plane, measuring the delay in signaling and control messages.
Per IMSI Metrics:
Uplane Bandwidth/Throughput: The bandwidth or throughput in the user plane, specific to each IMSI .
This feature enables deep packet analysis and session-level correlation for 5G Standalone (SA) user plane traffic. It extracts key information from GTP-U tunnels and correlating it with HTTP/2.
Key Functionalities:
GTP-U Extraction:
Decodes GTP-U headers and retrieves inner IP payloads for user-plane sessions.
Extracts key identifiers such as TEID, UE IP, QoS Flow Identifier (QFI), and Tunnel Endpoints.
HTTP/2 Extraction:
Parses HTTP/2 requests, responses, and headers (e.g., :method, :path, :authority).
Identifies and reconstructs HTTP/2 streams over TCP/QUIC sessions.
Correlation Engine:
Maps GTP-U session data with corresponding HTTP/2 flows using UE IP and session metadata.
Enables per-user, per-session correlation between transport and application KPIs.
Analytics and Export:
Generates per-session KPIs (latency, throughput, error rate, retransmissions).
Supports export to Kafka, ElasticSearch, or external monitoring systems.
Benefits:
Enables end-to-end visibility from 5G transport to application layer.
Improves troubleshooting of latency, congestion, and QoS degradation issues.
Enhances KPI accuracy by linking transport sessions to application activity.
Subscriber-Aware Load Balancing (SALB) is a technique used in telecom and mobile core networks (such as EPC, 5G Core, or DPI-based systems) to distribute user traffic intelligently.
Enhanced Subscriber Intelligence: The load balancing feature significantly enhances the ASN node's capability in enabling subscriber-level intelligence. It achieves this by egressing correlated control and user plane traffic to probes for in-depth analysis.
Efficient Load Distribution: This feature ensures efficient distribution of network load across multiple tools. By balancing the traffic, it prevents any single tool from becoming overwhelmed, thereby maintaining optimal network performance.
Comprehensive Network Analysis: The load balancing feature is crucial for achieving comprehensive network analysis. By directing correlated traffic to specific probes, it allows for detailed monitoring and assessment of traffic pattern.
Currently, wo subscriber-aware load balancing options are available, which can be configured based on customer requirements:
Packet deduplication is a feature used to identify and eliminate duplicate network packets, improving network efficiency and reducing redundant data processing. It works by comparing incoming packets.
Deduplication Process: Traffic is continuously analysed in real-time with a granularity of up to 8 milliseconds, enabling the rapid detection and elimination of duplicate packets. The analysis process begins by inspecting ingress packets for familiarity based on their type and fields. If a packet is found to exist within the customer-defined time frame, it is identified as a duplicate and dropped. Users can configure the Packet Source (Full or Routed Packet) to filter out redundant traffic, even across multiple hops. Anchor & Offset settings define where and how packet data is compared, while the Window Size (2-8ms) ensures efficient real-time deduplication. For detailed configuration, refer to this link .
ASN_SUBSCRIBER_BASIC
5G-C traffic extraction & Correlation.
N4 and N3 Correlation for 5G-SA.
N11 and N3 Correlation for 5G-SA.
Metadata Extraction for N4, N3, N11.
SBI Metadata Extraction for both public & private 5GC vTap.
4G LTE & 5G NSA Traffic Extraction and GTP Correlation.
S1-U & S11 Correlation for 4G and 5G NSA.
S5-S8 Correlation for 4G and 5G NSA.
CUPS support
Metadata Extraction for S1-U, S11, N3, N4, N11.
Subscriber-Aware Load Balancing.
Advanced Filtering, Forwarding, Load Balancing, and Header Stripping.
KPI Calculation.
Metadata export via Kafka.
Subscribers - 1M
Sessions-15M
ASN_SUBSCRIBER_ADVANCED
ASN_SUBSCRIBER_BASIC.
Subscribers - 2M
Sessions-30M
ASN_SUBSCRIBER_PERFORMANCE
ASN_SUBSCRIBER_ADVANCED + Pcap Generation.
Subscribers - 3M
Sessions-45M
ASN_APPLICATION_BASIC
IP session management.
DPI application identification
Dynamic DPI upgrade
Advanced Filtering, Forwarding, Load Balancing & Header Stripping.
Metadata Extraction for IP Networks (DC, FTTH, Edge & Campus).
PPoE, IPoE support.
VxLAN,GRE,ERSPAN tunnel support.
VxLAN Stripping support - both SW & HW offload.
GRE Stripping support.
KPI Calculation
Metadata export via Kafka.
SIP-RTP Correlation, extraction and export
No. of Applications - Upto 500
Sessions- 15M.
ASN_APPLICATION_ADVANCE
ASN_APPLICATION_BASIC.
No of Applications - Upto 1000
Sessions - 30M
ASN_APPLICATION_PERFORMANCE
ASN_APPLICATION_ADVANCE + Packet Dedup + Pcap Generation.
No of Applications - 1000+
Sessions - 45M.
IMEI - Vendor-Specific - 3GPP, Type - 3GPP-IMEISV(20)
MSISDN - Calling-Station-Id
APN - Called-Station-Id
Virtual APN - Vendor-Specific - Starent Type SN-Virtual-APN-Name
User Name - User-Name
Packet Code - Code
Packet Identifier - Packet Identifier
PGW IP Address - NAS-IP-Address
Assigned IP Address - Framed-IP-Address
Assigned IPv6 Address and Prefix - Framed-IPv6-Prefix
Input Bytes - Acct-Input-Octets
Output Bytes - Acct-Output-Octets
Input Packets - Acct-Input-Packets
Output Packets - Acct-Output-Packets
Session Time - Acct-Session-Time

Extract TEID from GTP-U packet
Correlate the TEID info with the existing GTP-C Data stored and get the corresponding User details
Prepare the Correlated Metadata and convert the metadata to JSON
Export the JSON metadata to Kafka.


ASN on NVIDIA ConnectX NIC: Aviz Service Nodes now support NVIDIA ConnectX NICs, expanding from prior x86 compatibility to deliver DPDK-accelerated, high-throughput packet processing.
ASN DPI: Deep Packet Inspection (DPI) is a powerful technique that analyzes network traffic at the packet level, going beyond basic header inspection to examine the payload of the actual data being transmitted.
ASN DPI Dynamic Upgrade: Aviz Service Nodes support in-service DPI upgrade for enhanced new DPI library integrations.
KPI Active communication on DC: This feature introduces a new KPI to measure the active bandwidth usage of control-plane sessions. It enables real-time monitoring of data transmission rates during session activity, helping operators track usage patterns, detect anomalies, and optimize resource allocation. This KPI enhances observability and supports detailed traffic analysis per session.
Radius support - , tailored to the needs o and other service providers. It allows configurable selection of RADIUS attributes for export, enabling integration with external analytics, billing, or monitoring systems. The flexibility helps align with varying customer requirements and simplifies downstream processing of authentication and accounting data.
Flex Export support - The flexibility helps align with varying customer requirements and simplifies downstream processing of authentication and accounting data.This feature provides flexible export capabilities for RADIUS-based session data,Uplane,5G data.
ASN DC mode Enhanced for IP session and FTTH support -
ASN App ID detection enhancements - ASN 2.1 improves the accuracy and coverage of Application ID detection, enabling better classification of network traffic based on application type. These enhancements support more granular visibility into user behavior, improve analytics precision, and help in enforcing app-level policies. This upgrade strengthens observability for both Telco and DC deployments.
Mode change support. -TELCO to DC or Vice-Versa
ASN also support Connect-X NIC
Comprehensive Telco feature set, memory optimisations & critical bug fixes • Retains all capabilities from ASN 2.0 • Enhanced metadata extraction • Improved stability and performance
Comprehensive Packet Capture Support – Troubleshooting and network analysis are more efficient with enhanced packet capture capabilities. Purpose-built for both enterprise and telco environments, this feature enables real-time data collection for faster diagnostics and resolution of network issues.
Building on a Strong Telco Foundation – ASN R2.0 retains all the powerful telco features introduced in version 1.3.1, ensuring continuity, stability, and proven reliability for carrier-grade deployments.
The Packet Capture feature allows users to capture network traffic on selected interfaces for analysis. It provides configurable options to define capture duration, file size limits, & interface.
In the high-stakes world of telco networks, operators must manage massive subscriber traffic while ensuring optimal performance, metadata extraction, and application identification. Subscriber traffic, split into control packets (e.g., GTP-C, PFCP, N11) and user packets (GTP-U), is often processed separately in the core network, complicating analysis. Without precise correlation, directing both traffic types to the same tool for comprehensive insights is inefficient and prone to errors.
Introducing Subscriber-Aware Load Balancing (SALB) in the Aviz Service Node (ASN), running standalone on the NVIDIA BlueField-3 (BF3) DPU. This solution harnesses P4 programmable datapath and embedded ARM cores to deliver peak datapath performance, ensuring correlated traffic reaches the right tools with unmatched efficiency. Now generally available, ASN SALB on BF3 DPU empowers operators to achieve high-speed, intelligent traffic processing for next-generation telco networks.
Modern networks—whether telco cores, enterprise data centers, or edge sites—demand flexible, high-performance packet intelligence to keep pace with AI-driven workloads and subscriber traffic. Aviz Service Nodes (ASN) deliver a software-defined solution for advanced traffic analytics, application identification, and AI-powered insights on commodity servers.
In our latest release, we’re thrilled to announce support for NVIDIA ConnectX NICs, building on our existing x86 platform compatibility. With ConnectX, ASN leverages cutting-edge NVIDIA technology to achieve unparalleled throughput, low latency, and future-proof scalability. From 4G/5G traffic correlation to real-time flow tracing, ASN on ConnectX empowers operators to modernize network observability effortlessly.
TAI (Tracking Area Identifier): Identifies the tracking area in LTE networks.
ECGI (EUTRAN CGI): A unique identifier for cells in LTE networks.
LAI (Local Area Identifier): Identifies the local area within a GSM network.
Macro eNodeB Field: Information related to the macro eNodeB, a type of base station in LTE networks.
Extended Macro eNodeB Field: Additional information for extended macro eNodeB configurations.
Cell Changed: Indicates whether the user's device has changed cells within the network.
IPv6 Address Downlink (eNodeB): The IPv6 address for the downlink to the eNodeB (Evolved Node B).
TEID Uplink (SGW): The Tunnel Endpoint Identifier for the uplink from the Serving Gateway (SGW).
TEID Downlink (eNodeB): The Tunnel Endpoint Identifier for the downlink to the eNodeB (Evolved Node B).
CONTROL TEID: The Tunnel Endpoint Identifier used for control plane signaling.
CONTROL IP: The IP address used for control plane signaling.
Radio Access Type (RAT): The type of radio access technology being used (e.g., LTE, 5G).
Uplane Latency: The latency in the user plane, measuring the delay in data transmission for each IMSI.
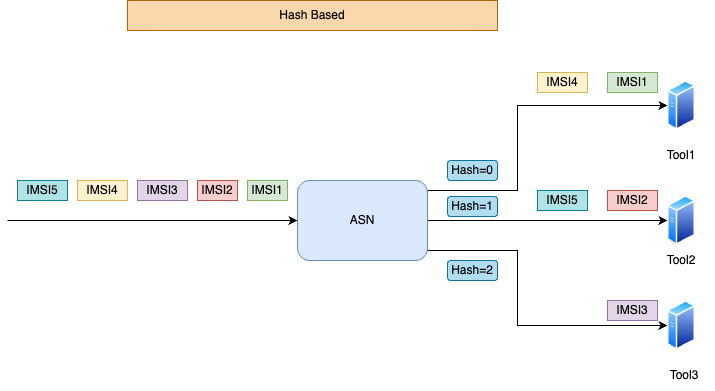
Subscriber aware load balancing based on IMSI
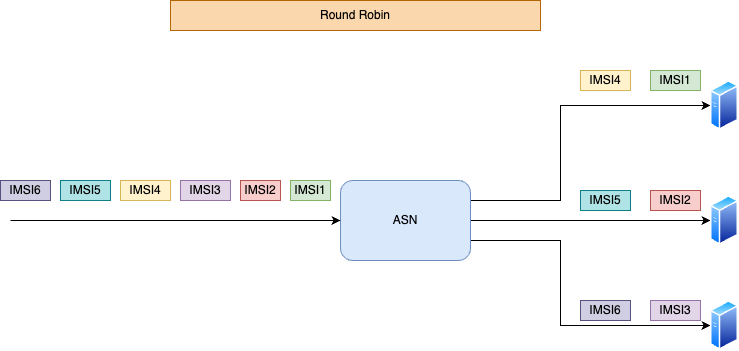
Subscriber aware load balancing in round-robin fashion
Hash based LB:
The IMSI is used to compute a hash value based on the number of probes in the core network. The hash function takes the modulo of the IMSI with the tool count, yielding a value between 0 and the tool count. This hash value is established when the first request packet of a subscriber flow is received. Using correlation logic, all subsequent control and user packets for the same subscriber are directed to the same tool, ensuring consistent and efficient traffic analysis.
Round Robin LB:
Alternatively, the ASN node can use round-robin load balancing, assigning flows to tools sequentially to evenly distribute the load, regardless of IMSI. A hash table maintains the tool ID for each subscriber, ensuring all packets from the same subscriber go to the same tool. This method effectively balances the network load, especially for large traffic flows.


This guide explains how to use the FlowVision Graphical User Interface (GUI) to manage ASN servers efficiently.
The FlowVision GUI provides the following top-level menu options:
FlowVision uses TCP port 443 for its Web-GUI and TCP port 8091 for communication with the ASN appliance.
The following image shows the home page of the Aviz FlowVision GUI:
Enable/Disable below Metadata extraction on the Service Node:
Source IP: IP address of the sender in the outer header.
Destination IP: IP address of the recipient in the outer header.
Source Port: Port number used by the sender in the outer header.
Destination Port: Port number used by the recipient in the outer header.
Protocol: Protocol used for communication in the outer header.
Source IP: IP address of the sender in the inner header.
Destination IP: IP address of the recipient in the inner header.
Source Port: Port number used by the sender in the inner header.
TEID: Tunnel Endpoint Identifier for the inner header.
App-Name: Name of the application associated with the traffic.
HTTP Data: Data transmitted over the HTTP protocol.
DNS Data: Data transmitted over the DNS protocol.
Correlation Status: Status indicating whether the information is correlated.
IMSI: International Mobile Subscriber Identity.
IMEI: International Mobile Equipment Identity.
In Flow vision UI : Both NCELL_ID and ECGI are common parameter and represented by CELL_ID parameter.
Total Bytes: Total number of bytes transmitted.
Total Packets: Total number of packets transmitted.
Uplane Bandwidth/Throughput: Bandwidth or throughput in the user plane.
Uplane Latency: Latency in the user plane.
Configurable Metadata Extraction in ASN
From this page, you can enable or disable the following metadata extraction options on the Aviz Service Node (ASN) for 5G-SA:
IMSI (International Mobile Subscriber Identity): A unique identifier for a mobile subscriber.
IMEI (International Mobile Equipment Identity): A unique identifier for a mobile device.
MSISDN (Mobile Station International Subscriber Directory Number): The phone number associated with the subscriber.
APN/DNN (Access Point Name / Data Network Name): Defines the network path for data connections.
USER TYPE: Classification of the user, typically indicating subscriber type or service level.
5G-SA TYPE: Type of 5G network architecture, such as standalone (SA) or non-standalone (NSA).
UE IP ADDR(User Equipment IP Address):The IP address assigned to the user's device.
CGI (Cell Global Identifier): Unique identifier for a cell in a mobile network.
TAI (Tracking Area Identifier): Identifier for tracking areas in a 5G network.
Cell Changed: Indicates whether the user's device has changed cells within the network.
IPV4 Address Uplink (UPF): IPv4 address for the uplink from the User Plane Function (UPF).
IPv4 Address Downlink (RAN): IPv4 address for the downlink to the Radio Access Network (RAN).
IPv6 Address Uplink (UPF): IPv6 address for the uplink from the User Plane Function (UPF).
Cplane Latency: The latency in the control plane, measuring the delay in signaling and control messages.
Per IMSI Metrics:
Uplane Bandwidth/Throughput: Bandwidth or throughput in the user plane for each IMSI.
Enable/Disable below Metadata extraction on the Service Node:
Source IP: IP address of the sender in the inner header.
Destination IP: IP address of the recipient in the inner header.
Source Port: Port number used by the sender in the inner header.
Destination Port: Port number used by the recipient in the inner header.
Protocol: Protocol used for communication in the inner header.
App-Name: Name of the application associated with the traffic.
HTTP Data: Data transmitted over the HTTP protocol.
DNS Data: Data transmitted over the DNS protocol.
In Flow vision UI : Both NCELL_ID and ECGI are common parameter and represented by CELL_ID parameter.
Total Bytes: Total number of bytes transmitted.
Total Packets: Total number of packets transmitted.
Uplane Bandwidth/Throughput: Bandwidth or throughput in the user plane.
Uplane Latency: Latency in the user plane.
Processed data is streamed via Kafka to customer analytics tools for visualization, reporting, and anomaly detection
The list below specifies the unique unified data type of metadata attributes exported from ASN, 5GC-control-session-data-mapping, EPC-control-session-data-mapping, and the user-session-data-mapping file.
SIP–RTP refers to the combination of two protocols used together to deliver real-time voice and video calls, especially in VoIP, IMS, and telecom networks.
Voice and video calls over IP use two major protocols:
SIP (Session Initiation Protocol) → Signaling
RTP (Real-time Transport Protocol) → Media (voice/video)
Because SIP carries only signalling and RTP carries the actual media, correlation is required to associate RTP flows with the corresponding SIP session.
This feature enables ASN-DPI to:
Parse SIP and extract SDP parameters
Track media endpoints (IP:Port)
Correlate live RTP traffic to the SIP session
Export SIP and RTP metadata to Kafka topics
SIP is responsible for:
Setting up a call
Exchanging SDP with codec & media IP/port
Modifying the session
Ending the call
Important: SIP does not carry media. It only negotiates media parameters.
SDP is embedded inside SIP messages (INVITE, 200 OK, ACK).
SDP contains:
Media types (voice, video, dtmf, etc.)
Codec formats
Media IP and port
Transport protocol (e.g., RTP/AVP)
This is the key information used for SIP→RTP correlation.
Carries actual audio/video packets.
Does not contain SIP identifiers.
ASN-DPI correlates RTP streams by SrcIP/DstIP/SrcPort/DstPort with SDP parameters.
Why is it needed?
RTP packets contain no SIP call ID or SIP headers.
To identify SIP sessions, need to do correlation Thus DPI must match SDP media endpoints: ip:port
To manage connected nodes from the FlowVision GUI, click System > Devices.
The Devices screen shows all the connected nodes and their connection status. The nodes that are online are shown with a green status and the nodes that are offline are shown in a red status.
You can click the icon to reboot an active ASN appliance, restart the ASN application, or remove the ASN database configuration, as shown below.
To view the system log from the FlowVision GUI, click System > Syslog.
The Syslog page shows the system logs of all the nodes that are online. You can click the device icon for each of the online devices to get the system log for that particular device. The system log shows the device IP, component, severity level, time stamp, and the severity level message with more specific information.
The following image shows the system log table of a device:
You can change the severity level of the messages displayed in the syslog table using the Severity Level drop-down menu. The available options are Debug, Info, Notice
Protocol: Protocol used for communication in the inner header.
UE IP ADDR: IP address assigned to the User Equipment.
Traffic Direction: Direction of traffic flow.
RAT Type: Type of Radio Access Technology used.
MSISDN: Phone number
NCELL_ID: If data is from 5GSA, it shall indicate cell ID. Otherwise, it shall be null
ECGI_ECGI : If data is from 5GNSA, it shall indicate cell ID. Otherwise, it shall be null


Connection address and port of the media stream: <IP>:<Port> taken from "m=" or "c=" SDP lines.
SIP_SDP_MEDIA_NUMBER_OF_FORMATS_0
Number of payload formats listed for this media stream.
SIP_SDP_MEDIA_FORMAT_0
List of RTP payload types (e.g., 8 13 101) offered or accepted for this media stream.
The sample clock rate for the codec (e.g., 8000 for G.711) used for timestamp progression.
RTP_Channels
Number of audio channels (mono=1, stereo=2), taken from SDP attribute fields.
RTP_SeqNo
The packet’s RTP sequence number used for packet ordering, loss detection, and OOO detection.
RTP_Timestamp
RTP timestamp that indicates the playback position based on the codec’s clock rate.
RTP_Payload
RTP payload type number identifying the codec or special types like comfort noise (13).
RTP_PacketInterval
The theoretically expected inter-packet spacing in milliseconds based on codec frame size (e.g., 20ms for G.711).
RTP_PacketIntervalMeasured
Actual measured time difference between consecutive RTP packets received, used for jitter detection.
KPI_RTP_PacketLost
Total number of missing sequence numbers indicating RTP packet loss over the flow.
KPI_RTP_Jitter
RTP jitter value, reflecting variation in packet arrival times.
KPI_RTP_JitterMs
Jitter expressed in milliseconds (converted from RTP timestamp units).
KPI_RTP_Frequency
The RTP clock frequency used for jitter and latency calculations (matches RTP_ClockRate).
KPI_RTP_PacketOverhead
Total overhead bytes per RTP packet including IP/UDP/RTP headers (used for bandwidth analysis).
KPI_RTP_PacketOoo
Count of packets arriving out-of-order compared to sequence numbers.
KPI_RTP_PacketDuplicate
Count of duplicate RTP packets with identical sequence numbers.
Field Name
Explanation
SIP_CALL_ID
Unique identifier of the SIP call (from the Call-ID header). Used to correlate all SIP messages and RTP streams belonging to the same call.
DIRECTION
Direction of this signaling leg relative to the probe (e.g., UPLINK / DOWNLINK). Typically derived from the interface or IP rules.
ExpType
SIP session classification (e.g., NORMAL, ERROR, RETRY). Indicates how the SIP session was processed.
SIP_SDP_MEDIA_COUNT
Number of m= media lines in the SDP body. Each media line represents one media stream (audio/video).
SIP_SDP_MEDIA_TYPE_0
Media type of the first m= line, e.g., “audio” or “video”.
SIP_SDP_MEDIA_PROTOCOL_0
Transport protocol for the media stream from SDP (e.g., RTP/AVP, RTP/SAVP, UDP/TLS/RTP/SAVPF).
Field Name
One-Line Explanation
SIP_RTP_SessionID
A SIP-derived unique session identifier linking the RTP media stream to its corresponding SIP call
RTP_AV_SessionID
Internal media stream identifier used to differentiate individual audio/video flows within the same call.
RTP_SenderID
Unique ID representing the endpoint sending the RTP packets, derived from SIP signaling.
RTP_ReceiverID
Unique ID representing the endpoint receiving the RTP packets, used to identify the destination leg of the media stream.
RTP_EncodingName
Codec name negotiated in SDP (e.g., PCMU, PCMA, OPUS, CN), indicating how payload bytes must be interpreted.
RTP_MediaType
Indicates whether the RTP flow carries audio or video, extracted from SDP (m= line).
SIP_SDP_MEDIA_CONNECTIONS_0
RTP_ClockRate
IPv6 Address Downlink (RAN): IPv6 address for the downlink to the Radio Access Network (RAN).
TEID Uplink (UPF): Tunnel Endpoint Identifier for the uplink from the User Plane Function (UPF).
TEID Downlink (RAN): Tunnel Endpoint Identifier for the downlink to the Radio Access Network (RAN).
RAT (Radio Access Type): The type of radio access technology used, such as 5G NR.
Uplane Latency: Latency in the user plane, measuring data transmission delay for each IMSI.
To delete a device, click the icon.
ASN configurations are automatically saved to the database at regular intervals; however, you can use the icon to save the configuration explicitly.
The following image shows the Nodes page:
To add a new device,
Click the icon at the top right corner of the Devices page. The Add New Device window displays.
Default Credentials:
Username: admin
Password: admin
Specify the values for IP Address, Username, and Password in their respective fields.
Click Save to apply your changes and add the device. Click Discard to discard your changes.
The following image shows the ASN fabric information charts:
The platform health table shows you the CPU usage, and memory availability for each connected node. From this data, you can infer the overall health of the platform.
The following image shows the platform health table:
The link information table displays the total number of ports across all connected nodes, the number of ports enabled with administrative privileges, and the number of ports that are down.
The following image shows the link information table:
The top 5 ports by traffic show you the top 5 ports across all connected nodes sorted on the basis of their traffic rate. The table shows you the device, port, Mode, In Pkts & the number of In Discards.
The following image shows the top 5 ports by traffic table:
The SYSLOG Statistics shows you the nodes sorted based on the SYSLOG messages. The table shows the device IP, and the number of SYSLOG messages, filtered by severity.
The following image shows the SYSLOG Statistics:
The ASN Module Status shows the top nodes and their health with details about the various components of ASN sorted node IP.
The following image shows the ASN Module Status:
HA Status
The HA Status shows the HA status between the connected nodes along with the Cluster Status & Data Export Status.
The following image shows the HA Status:
To access the system and device information, click System > General.
The system information table shows you the product name, version, and technical support information about the system.
The following image shows you the system information tab:
The Devices Information table shows detailed information and properties of each connected ASN node. For each ASN node, the table shows the IP address, the MAC address, the Name of the device, the Version, the location, the Ubuntu version of the service, uptime, and the options to edit them.
You can edit device properties from the Devices Information table:
Click the Edit button corresponding to the required node on the Devices Information table. The Device Properties window displays.
Change the required node property value in the editable fields. Currently, you can edit the Name and Location.
Click Save to apply your changes.
ASN DPI (Deep Packet Inspection) identifies applications using pattern-based signatures. Aviz Networks provides seamless signature updates, allowing support for new applications or enhancements of existing ones without impacting the existing deployment.
During the ASN DPI upgrade, there will be a momentary traffic drop.
Follow these steps to upgrade ASN DPI without restarting ASN modules:
1. Copy the Signature File to the ASN Device
2. Extract the Tar file
3. Navigate to the Installation Directory
4. Execute the Upgrade Script
asn-dpi*.tar.gz in this * means unique file Release Number/Name corresponding to the update.
Deep Packet Inspection (DPI) is a powerful technique that analyzes network traffic at the packet level, going beyond basic header inspection to examine the payload—the actual data being transmitted.
ASN Deep Packet Inspection enables precise identification of 2,700+ applications and 9,000+ subcategory applications, and their attributes by analyzing network traffic in detail. This capability allows organizations to know exactly which apps are running—whether it’s video, audio, gaming, file transfer, or chat—along with the underlying protocols they use. Categorizing traffic helps in applying tailored policies for security, bandwidth allocation, and compliance. By understanding both the app and its category, enterprises and telcos can optimize network performance, enforce acceptable use policies, and gain valuable insights into user behavior and traffic trends
For telecom operators, ASN DPI delivers detailed application, protocol, and category identification—covering over 2,700+ apps—combined with critical session KPIs such as average, max, and min bandwidth, uplink/downlink latency, and packet retransmissions. This data helps telcos monitor how many users are engaging with each app and how network resources are being consumed in real time. By correlating user behavior with network performance metrics, telcos can optimize bandwidth allocation, improve quality of service for high-priority applications, and quickly troubleshoot performance issues. Additionally, rich metadata like HTTP hostnames and user-agent information aids in refining subscriber analytics, enabling personalized service offerings and efficient network management.
In data centers and enterprise networks, ASN DPI combines accurate app, protocol, and category identification with detailed session metrics—such as bandwidth usage, latency, and packet loss—to provide deep visibility into application performance and user experience. Tracking how many users access specific applications and the bandwidth consumed per session allows IT teams to optimize resource allocation and enforce security policies effectively. Latency and retransmission data help identify network bottlenecks or faulty links, enabling proactive issue resolution. Supplemented by metadata like HTTP URLs and user agents, this granular insight empowers enterprises to manage complex traffic flows, ensure compliance, and enhance overall network reliability and efficiency.
DPI Dynamic Upgrade: Always Stay Current:
In a fast-changing digital landscape where new applications and protocols constantly emerge, a static DPI quickly becomes outdated. ASN-DPI addresses this challenge with a robust DPI dynamic upgrade mechanism, allowing its detection engine and protocol signature database to be updated on the fly—without service interruption or the need for full software redeployment.
DPI metadata payload support Headers List:
To manage users from the FlowVision GUI, click System > User Management.
The User Management page shows the details of all the users of the system and their user privileges and roles. From the User Management page, you can add new users, edit user roles and permissions, de-activate a user, and delete a user.
You must have admin privileges to add, edit, or delete a user.
The following image shows the User Management page:
To add a new user,
Click the ADD button on the header of the user management table at the top. The New User window displays.
Specify the Email address, Username, Password, and Role of the new user in their respective fields. The Role drop-down field has two options - Admin and Viewer. The Admin role has full access and the Viewer role has read-only access.
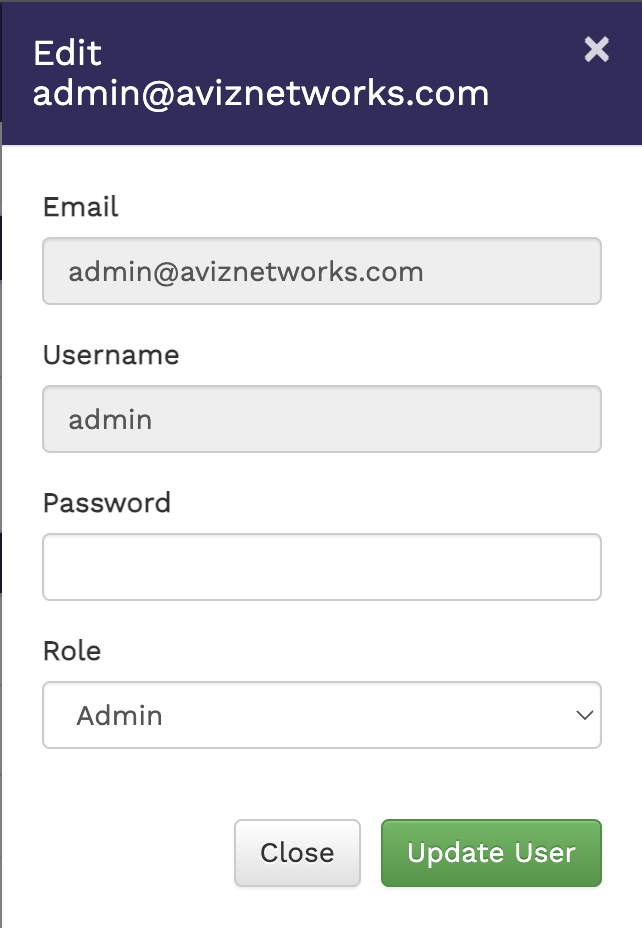
To edit an existing user,
Click the Edit button against the user in the User Management table. The Edit User window displays.
Edit the required details in the Email, Username, Password, and Role fields.
Click Update User to update the user details.
In the User Management table,
Click the De-Activate button to deactivate a user.
Click the Delete button to delete a user.
The configuration menu helps you perform the following:
The System menu lets you perform the following actions:
The following Metadata Attributes can be modified using this menu:
Radius
scp asn-dpi-*.tar.gz <ASN_DEVICE>
tar xzvf asn-dpi-v1-(Name).tar.gz cd asn-dpi-install/sudo ./upgrade_dpi.shHTTP2
HTTP
DNS
SSL
QUIC
RTP
SIP
SSH
NetBiosClick Save to create the user.
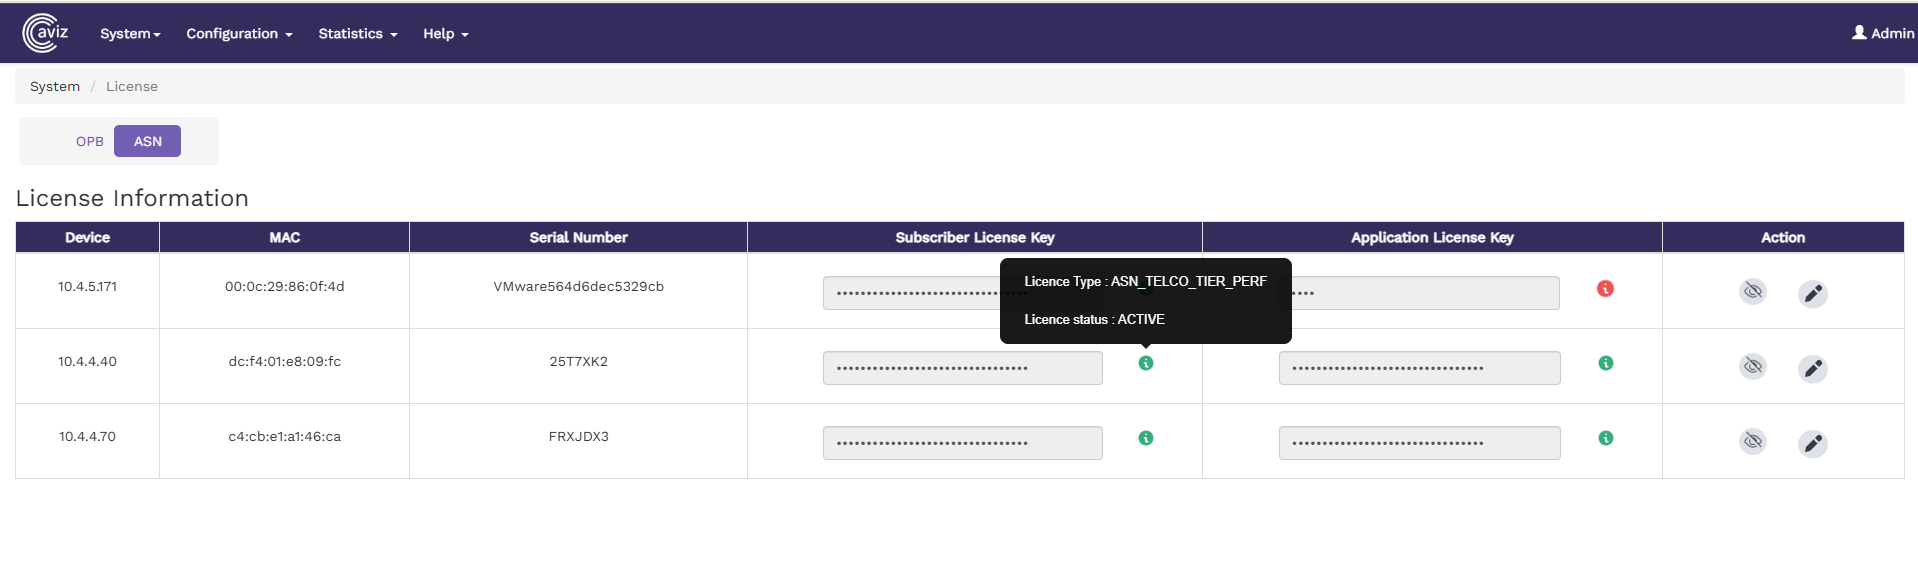
To configure the Licenses for ASN Nodes from the FlowVision GUI, click System > Licence
This page displays the current license details in a table format along with Node IP, MAC Address & Serial Number allowing you to either add a new license key for a new ASN device or update an existing license.
The following license details are shown for each ASN device:
Subscriber License Key, Type & Status
Application License Key, Type & Status
To add or modify the license for an ASN node, follow these steps:
Click on the Edit button on the license table next to the respective Node
A popup window will appear with the following fields:
Subscriber License Key
In the License Information Table, the Subscriber License Key and Application License Keycolumns include an information icon
When hovering over the info icon, detailed license information will be displayed, including:
License Type
License Status
Configurable Metadata Extraction in ASN
From this page, you can enable or disable the following metadata extraction options on the Aviz Service Node (ASN) for 5G-NSA:
IMSI (International Mobile Subscriber Identity): A unique identifier for a mobile subscriber.
IMEI (International Mobile Equipment Identity): A unique identifier for a mobile device.
MSISDN (Mobile Station International Subscriber Directory Number): The phone number associated with the subscriber.
CGI (Cell Global Identifier): A unique identifier for a cell in a mobile network.
SAI (Service Area Identifier): Identifies the service area within a network.
RAI (Routing Area Identifier): Specifies the routing area within a mobile network.
IPv4 Address Uplink (SGW): The IPv4 address for the uplink from the Serving Gateway (SGW).
IPv4 Address Downlink (eNodeB): The IPv4 address for the downlink to the eNodeB (Evolved Node B).
IPv6 Address Uplink (SGW): The IPv6 address for the uplink from the Serving Gateway (SGW).
Cplane Latency: The latency in the control plane, measuring the delay in signaling and control messages.
Per IMSI Metrics:
Uplane Bandwidth/Throughput: The bandwidth or throughput in the user plane, specific to each IMSI .
To perform a backup or restore from the FlowVision GUI, navigate to: System > Backup/Upgrade
The Backups page displays a list of available system backup files with the following details:
Backup Filename
Date of Backup Creation
Backup Status
Option to Delete Specific Backup Files
Additionally, this page provides options to:
Upgrade the system using a .jar file.
Upgrade the database using a local .sql file.
The following image illustrates the Backups page:
To create a new backup, click the Create Backup drop-down menu and select Create Backup. This action creates a new backup file, displaying its status in the backup table.
You can also have the option to selectively backup the database or the FlowVision system. To perform this selective backup,
Click Create Backup > Create Backup. The New Backup window displays.
This will take the backup of the DB and Flowvision.
Click Create Backup > Create Backup (Advanced).
Select the backup you want to create. The available options are - Backup DB and Backup FlowVision. This is a multi-select option where you can choose either or both.
Click Backup to create the selected backup.
After completing a backup, you can find the list of backups in a table format below
Click on the Restore Icon to restore that particular backup (.sql / .jar ).
The New Backup window displays, used need to select Restore DB or Restore FlowVision or select both if both are available, then Click on the Restore button.
After Restore is completed, there will be a pop-up -
The user needs to refresh the browser after 1 minute interval.
Note: The user also can download the backup files ( .sql / .jar ) by clicking the Download Icon, it will save the file to the local system.
You can upgrade the FlowVision system if required. To upgrade,
There are 2 types of upgrade provided
Click Upgrade System on the top right corner of the Backups page. The Upgrade System window displays.
Select the Upgrade FlowVision checkbox and select .jar file from the local system
Click Upgrade to upgrade the system.
After the Upgrade, there will be a popup that -
The user needs to refresh the browser after 1 minute interval.
Click Upgrade System on the top right corner of the Backups page. The Upgrade System window displays.
Select the Upgrade DB checkbox and select .sql file from the local system
Click Upgrade to upgrade the system.
After the Upgrade, there will be a popup that -
To delete a specific backup file, click the icon against the corresponding backup file in the Backups table. Confirm the delete action in the Confirm Delete prompt.
Please use a valid flowvision.jar or fv-db.sql file during the upgrade.
To view the audit logs from the FlowVision GUI, click System > Audit Logs.
The audit logs table gives you the details of all the actions performed on the connected systems. The details include the action performed, the date, the IP address of the system used to login to the GUI, the resource used, the username of the operator that acted, and the status of the action.
The following image shows the audit logs table:
To configure ASN ports using the FlowVision GUI, navigate to:
Configuration > Ports.
This page displays:
Managed Nodes and their connected ports.
A detailed Ports Table showing:
Admin Status.
Link Status (UP = Green, DOWN = Red).
Speed & Mode.
Port Modes in ASN:
Cplane (Control Plane): Handles control-plane traffic, such as S11, N4, and N11.
Uplane (User Plane): Manages user-plane traffic, including S1-U and N3.
The following image illustrate the ports page with device, ports, and port status details:
Hover over a device or port icon for additional details.
To edit the properties of a port,
Click the Edit button against the required port in the ports table. The Port Properties window displays.
Update the above properties as required.
The following properties can be updated -
Description: Sets a custom link description
Admin Status: Configures the port’s administrative state (Up/Down).
GRE Strip: Enables or disables GRE stripping on incoming packets (applicable only to C-plane ports).
Click Save to apply the changes.
Once the port mode has been successfully changed, the ASN Core will automatically restart on the node to apply the updates
The Control Session Timeout Support feature enables automatic handling of inactive control-plane sessions by detecting and cleaning up sessions that exceed a defined period of inactivity.
To configure and manage control session timeout and active communication bandwidth of ASN via the FlowVision GUI, navigate to:
Configuration > ASN > Threshold and Timeout
Threshold and Timeout Configuration Options:
control session timeout
Selecting the control session timeout, you can configure both value by H:M.
KPI Active communication: configure threshold bytes and interval time
Below image show control session timeout and active communication configuration
To configure Boot Configuration using the FlowVision GUI, navigate to:
Configuration > Boot Configuration.
The following image illustrate the General configs such as hash table, ip & subscriber session limit, Coutn etc as shown below
LB Hash Type:
Specifies the method used for load balancing packet flows across processing cores.
3 Tuples: Uses source IP, destination IP, and protocol/port for hashing.
5 Tuples: Uses source IP, destination IP, protocol, source port, and destination port for hashing.
IP Session Limits:
Sets the maximum number of concurrent IP sessions per core.
Subscriber Session Limits:
Definition: Defines the maximum number of subscriber sessions (unique users/devices) that can be handled simultaneously.
The range is typically 100 to 3,000,000. Higher values require more memory and CPU resources.
Kafka Core Count:
Definition: Number of CPU cores dedicated to Kafka producer threads for exporting data.
Limitation: Must be less than or equal to the number of Packet Processing cores.
KPI Core Count:
Definition: Number of CPU cores allocated for Key Performance Indicator (KPI) processing tasks.
Limitation: Must be less than or equal to the number of Packet Processing cores.
Start Cores:
Definition: Specifies the logical core ID from which packet processing should begin.
Limitation: Must be a valid core ID present on the system. Incorrect values may prevent the application from starting.
Total Cores:
Definition: Total number of logical CPU cores allocated for packet processing and related tasks.
Limitation: Limited by the physical hardware; allocating more cores than available will result in errors.
Packet Processing Cores (Per Port)
Definition: Number of CPU cores assigned to process packets for each port.
Total Port
Definition: Number of asn ports configured for packet processing.
Limited by hardware capabilities and configuration, typically between 1 and 8.
Control Port
Definition: Designates the asn port used for control plane traffic.
Must select a valid port from available options (e.g., port0, port1)
The following image illustrate the Features and Packet core interface configs such as Radius, metadata export,4G & 5G interface type etc.
Enable Radius
Definition: Enables or disables support for the RADIUS protocol, used for authentication and accounting.
Set to "true" or "false" based on deployment requirements.
Active Bearer Export
Definition: Enables the export of active bearer information for monitoring or analytics.
Uplane Flow Stats (Control Metadata):
. Definition: Enables collection and export of user-plane flow statistics as part of control metadata.
Packet Core Interface:
Definition: Selects the type of packet core interface for network connectivity.
4G Interfaces: S5-S8, S11
5G Interfaces: N11
The following image illustrate the Kafka Producer configs such as Queue buffer, compression type etc.
Queue Buffer Messages (max):
Definition: Maximum number of messages buffered per Kafka queue before sending.
Range is 1,000 to 1,000,000,000.
Queue Buffer kbytes (max):
Definition: Maximum buffer size in kilobytes per Kafka queue.
Range is 1 to 2,147,483,647 kB.
Queue Batch Size (max):
Definition: Maximum number of messages sent in a single Kafka batch.
Range is 1 to 2,147,483,647.
Linger (ms):
Definition: Time in milliseconds to wait before sending a batch to Kafka, allowing more messages to accumulate.
Range is 0 to 900,000 ms.
Compression Type:
Definition: Compression algorithm used for Kafka messages.
Must be one of: none, gzip, lz4, zstd, snappy. Unsupported types will cause errors.
The list below specifies the unique unified data type of metadata attributes exported from ASN, 5GC-control-session-data-mapping, EPC-control-session-data-mapping, and the user-session-data-mapping file.
SIP-session-data-mapping
Radius-session-data-mapping
Configurable Metadata Extraction in ASN
From this page, you can enable or disable the following metadata extraction options on the Aviz Service Node (ASN) for 5G-SA:
IMSI (International Mobile Subscriber Identity): A unique identifier for a mobile subscriber.
IMEI (International Mobile Equipment Identity): A unique identifier for a mobile device.
MSISDN (Mobile Station International Subscriber Directory Number): The phone number associated with the subscriber.
CGI (Cell Global Identifier): Unique identifier for a cell in a mobile network.
TAI (Tracking Area Identifier): Identifier for tracking areas in a 5G network.
Cell Changed: Indicates whether the user's device has changed cells within the network.
IPV4 Address Uplink (UPF): IPv4 address for the uplink from the User Plane Function (UPF).
IPv4 Address Downlink (RAN): IPv4 address for the downlink to the Radio Access Network (RAN).
IPv6 Address Uplink (UPF): IPv6 address for the uplink from the User Plane Function (UPF).
Cplane Latency: The latency in the control plane, measuring the delay in signaling and control messages.
Per IMSI Metrics:
Uplane Bandwidth/Throughput: Bandwidth or throughput in the user plane for each IMSI.
Port Description.


USER TYPE: Classification of the user, typically indicating subscriber type or service level.
UE IP ADDR(User Equipment IP Address):The IP address assigned to the user's device.
TAI (Tracking Area Identifier): Identifies the tracking area in LTE networks.
ECGI (EUTRAN CGI): A unique identifier for cells in LTE networks.
LAI (Local Area Identifier): Identifies the local area within a GSM network.
Macro eNodeB Field: Information related to the macro eNodeB, a type of base station in LTE networks.
Extended Macro eNodeB Field: Additional information for extended macro eNodeB configurations.
Cell Changed: Indicates whether the user's device has changed cells within the network.
IPv6 Address Downlink (eNodeB): The IPv6 address for the downlink to the eNodeB (Evolved Node B).
TEID Uplink (SGW): The Tunnel Endpoint Identifier for the uplink from the Serving Gateway (SGW).
TEID Downlink (eNodeB): The Tunnel Endpoint Identifier for the downlink to the eNodeB (Evolved Node B).
CONTROL TEID: The Tunnel Endpoint Identifier used for control plane signaling.
CONTROL IP: The IP address used for control plane signaling.
Radio Access Type (RAT): The type of radio access technology being used (e.g., LTE, 5G).
Uplane Latency: The latency in the user plane, measuring the delay in data transmission for each IMSI.

USER TYPE: Classification of the user, typically indicating subscriber type or service level.
5G-SA TYPE: Type of 5G network architecture, such as standalone (SA) or non-standalone (NSA).
UE IP ADDR(User Equipment IP Address):The IP address assigned to the user's device.
IPv6 Address Downlink (RAN): IPv6 address for the downlink to the Radio Access Network (RAN).
TEID Uplink (UPF): Tunnel Endpoint Identifier for the uplink from the User Plane Function (UPF).
TEID Downlink (RAN): Tunnel Endpoint Identifier for the downlink to the Radio Access Network (RAN).
RAT (Radio Access Type): The type of radio access technology used, such as 5G NR.
Uplane Latency: Latency in the user plane, measuring data transmission delay for each IMSI.

Replace these fields with valid License values
After making the changes, click the Save button to apply the new license key


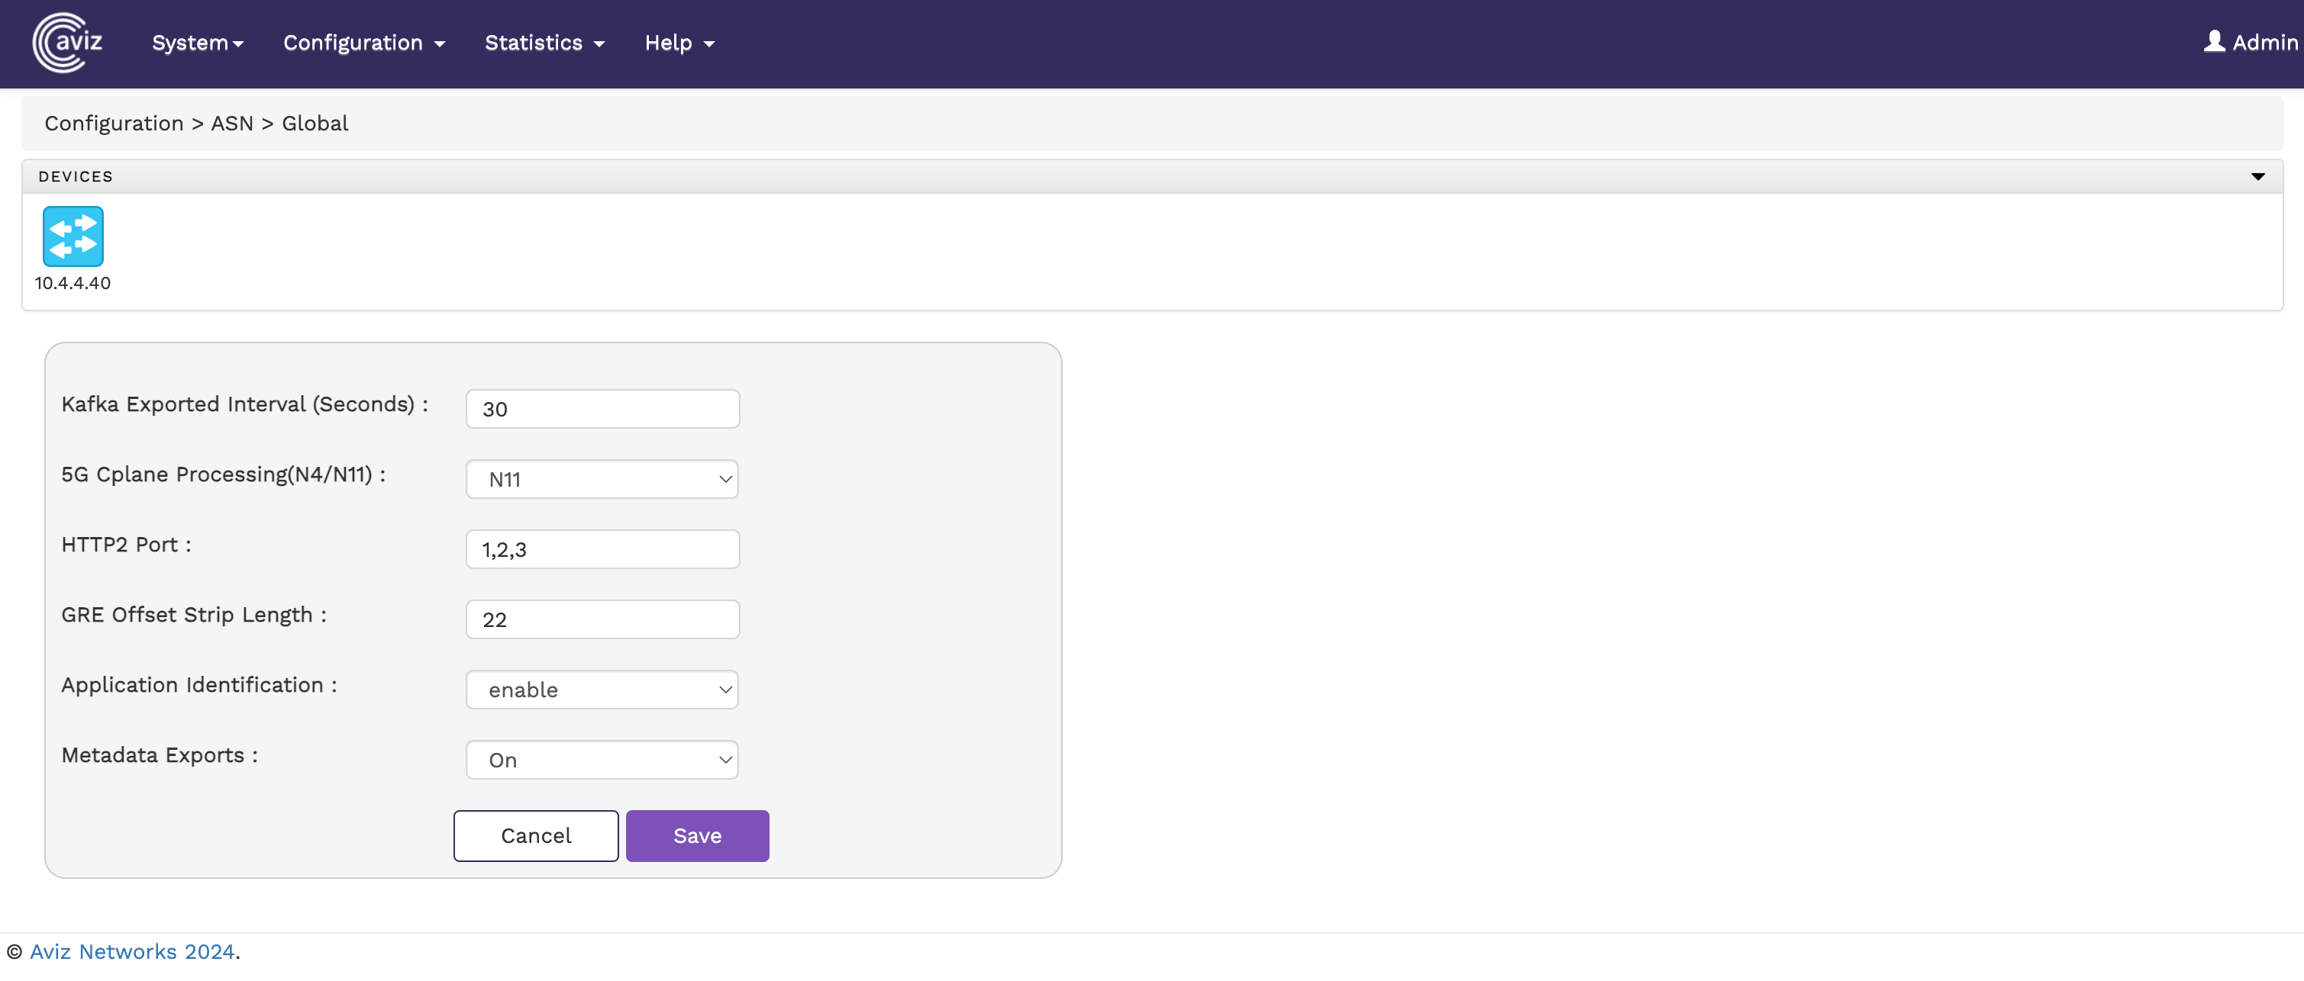
To view and configure ASN global parameters from the FlowVision GUI, navigate to:
Configuration > Global.
The following image illustrates the ASN Global page:
Select a Node to configure the below parameters:
Kafka Export Interval (seconds): Sets the interval for exporting data to Kafka, configurable between 5 to 300 seconds.
5G Cplane Processing (N4/N11): Choose between N4 or N11 for processing 5G control plane traffic.
HTTP2 Port: Define multiple HTTP2 ports, separated by commas (,).
The Statistics menu helps you perform the following:
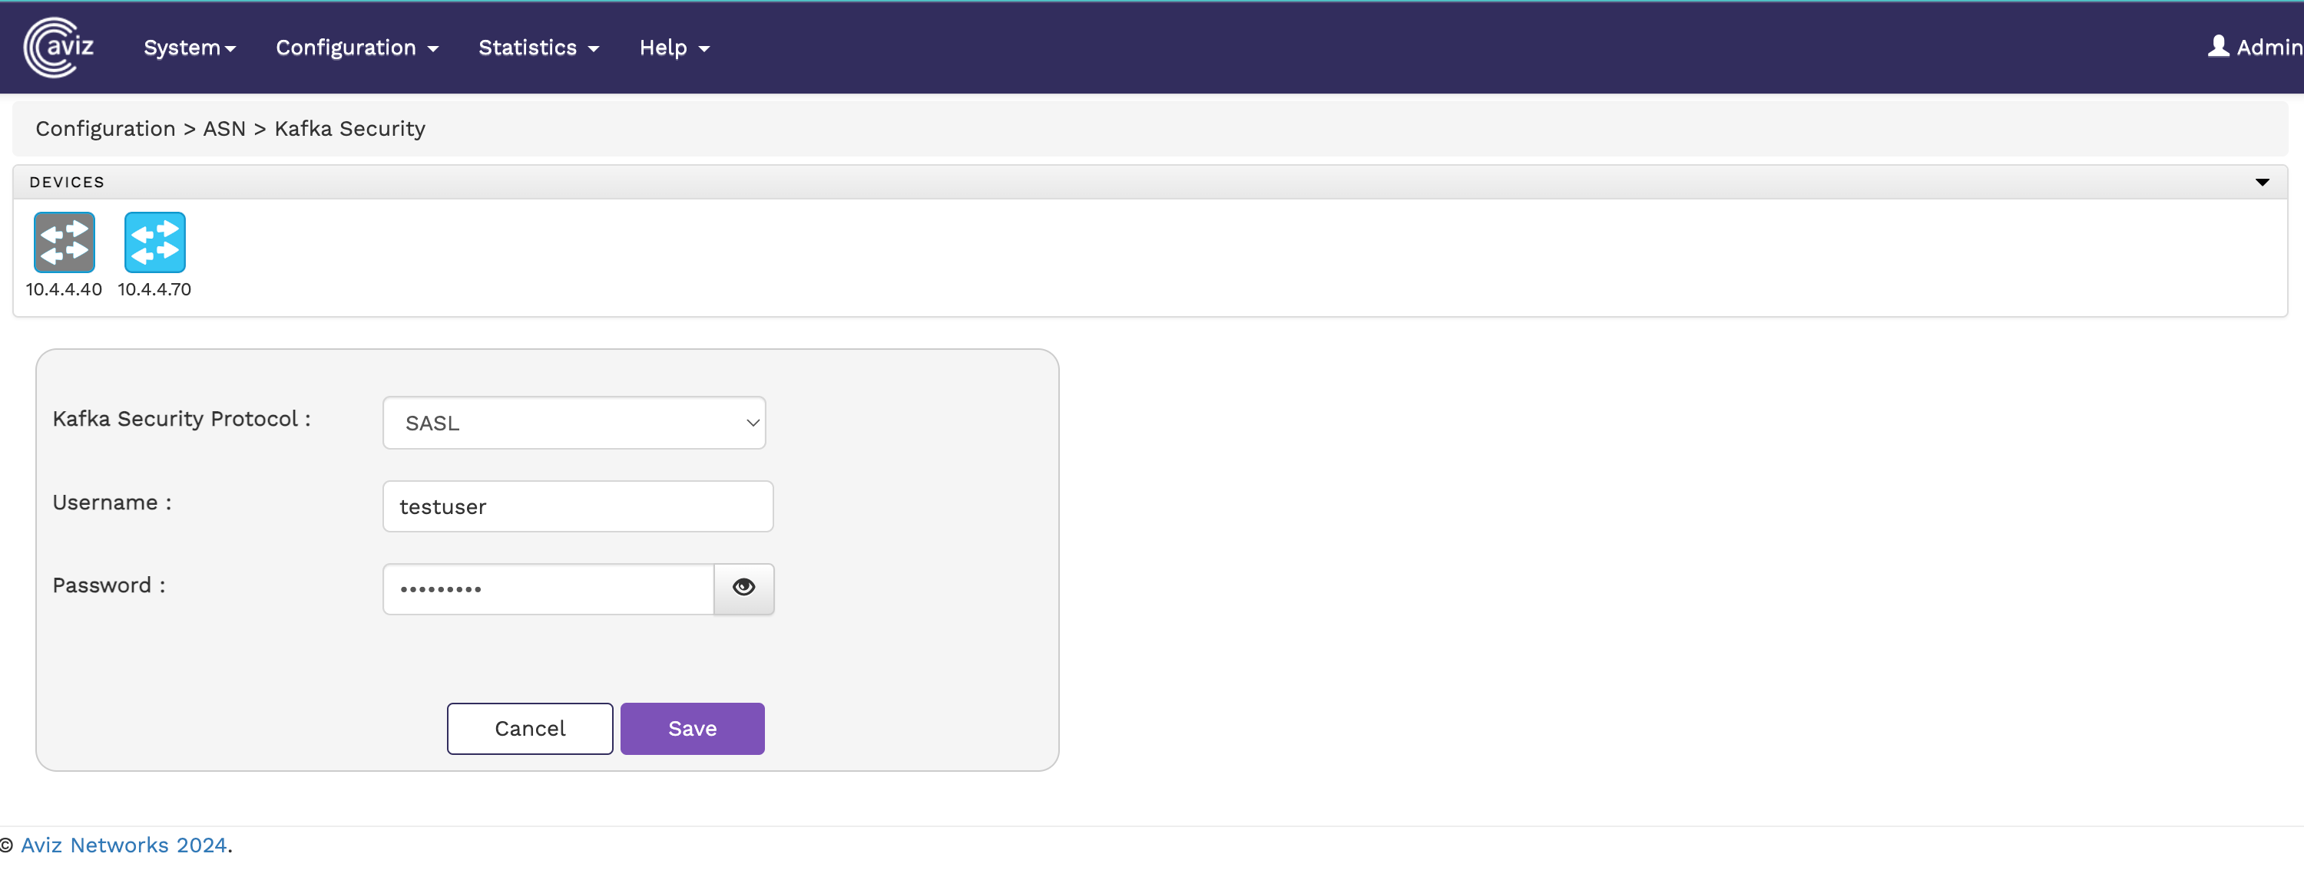
To configure Kafka Security settings in the FlowVision GUI, navigate to:
Configuration > Kafka Security
This page allows you to modify Kafka security protocols and their configurations.
Configure SASL authentication by providing:
Username
Password
Click Save to apply the changes.
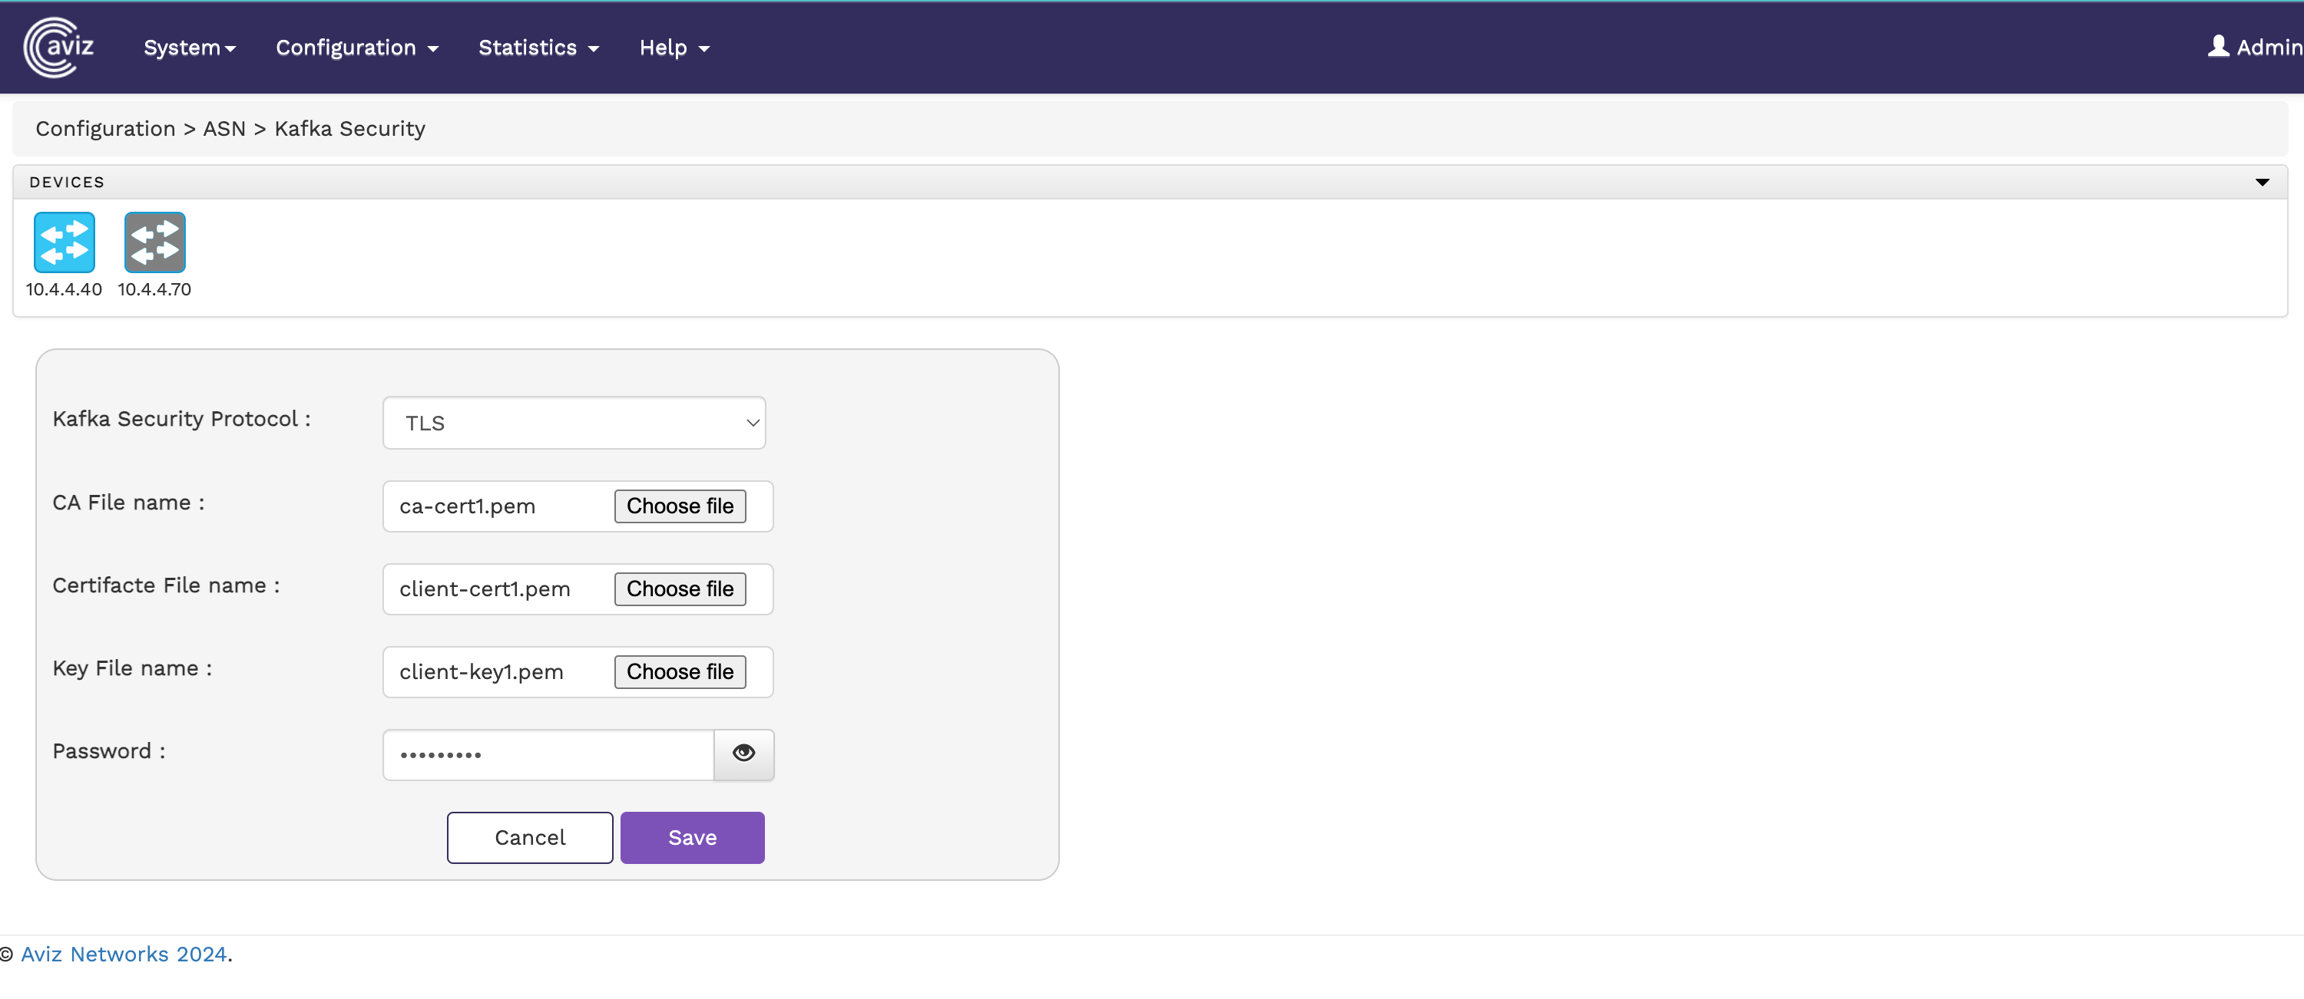
To enable TLS security, upload the required files:
CA File
Certificate File
Key File
Below image illustate TLS configuration page
Ensure the correct CA, Certificate, and Key files are uploaded.
Only .pem format files are supported.
If you don't want to configure SASL or TLS security, select "None" here to disable Kafka security.
If a user changes the configuration but clicks Cancel instead of Submit, the system reverts to the previous settings automatically.
Only an Admin can configure or modify Kafka security settings.
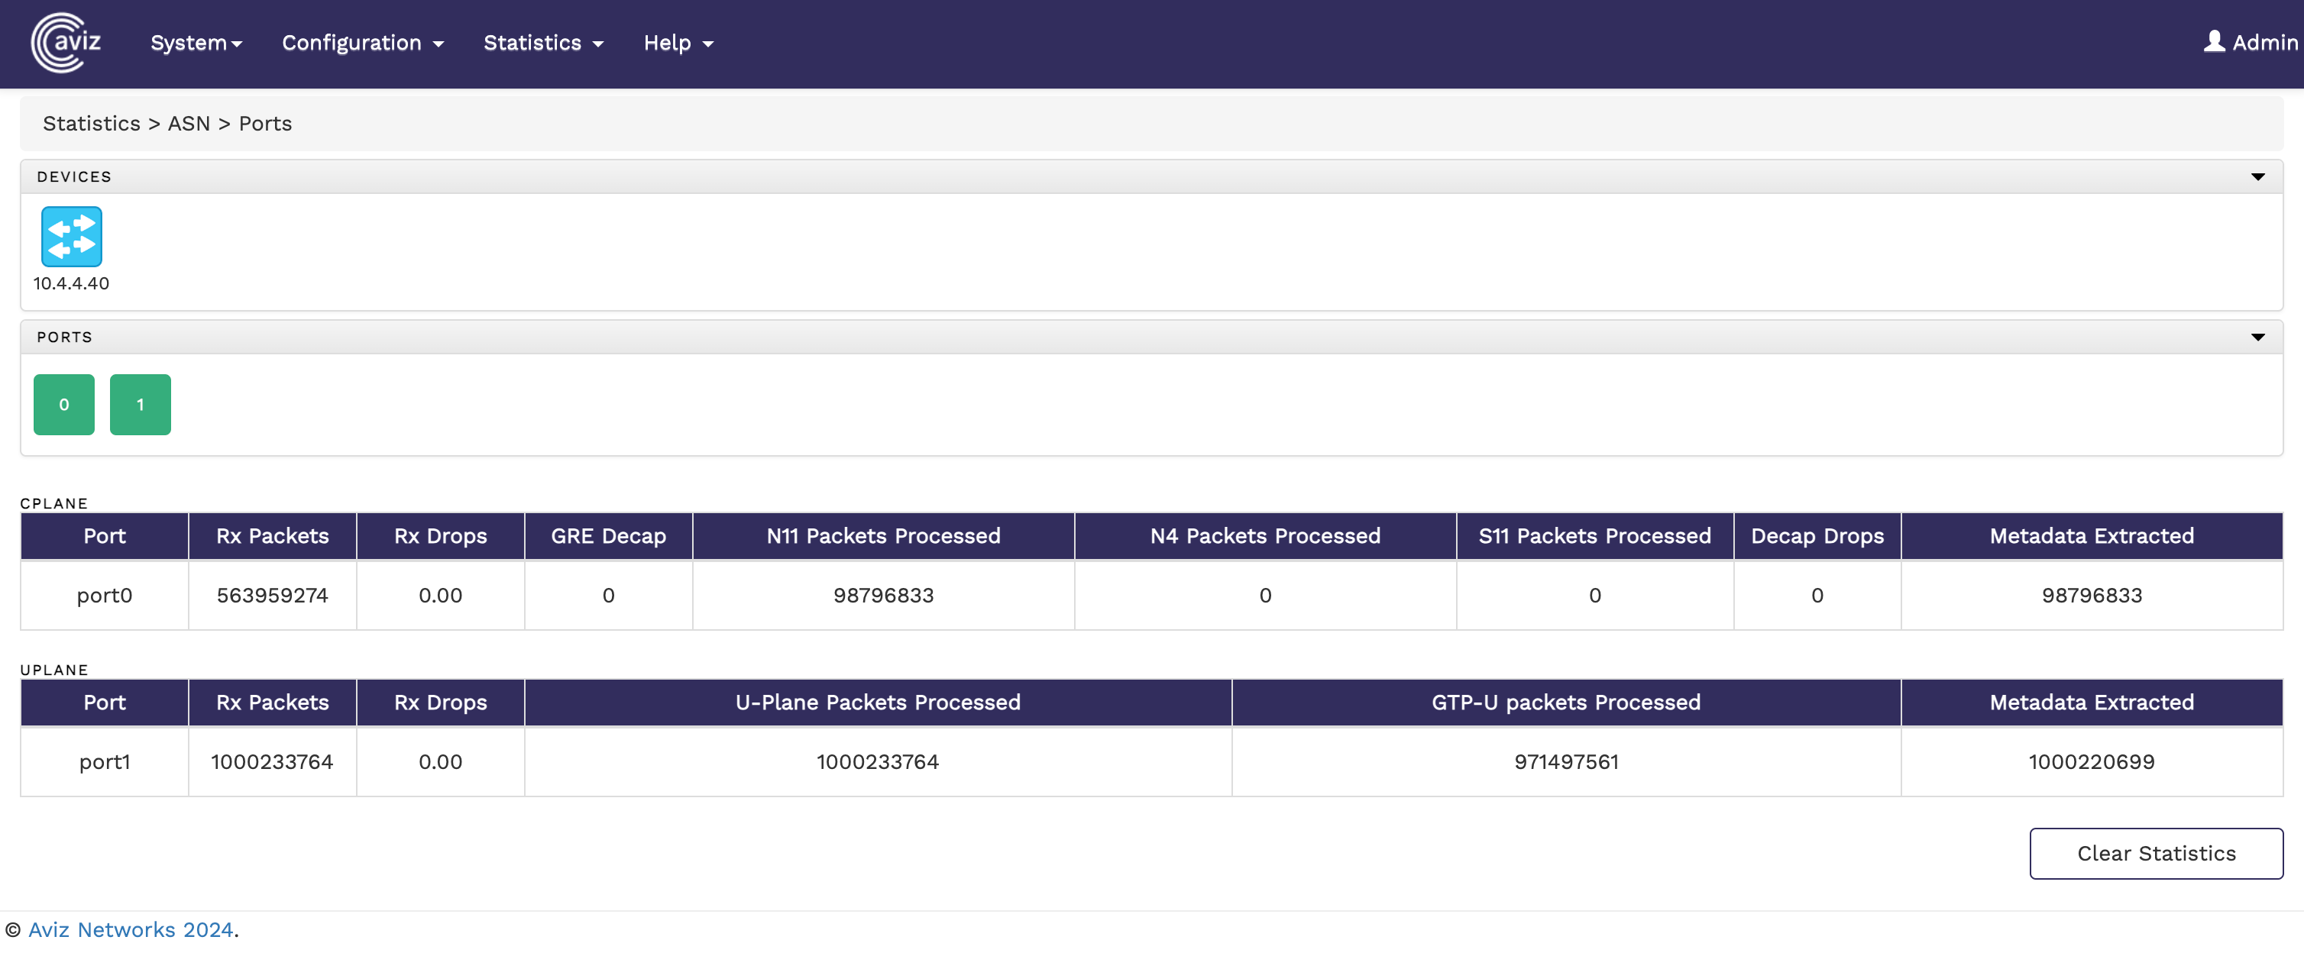
To view the port statistics of the connected devices from the FlowVision GUI, click Statistics >ASN> Ports.
The Ports statistics page shows you the connected Nodes, the available ports on each Node, and the counters. By default, when you select a device the statistics for all the ports in the device are displayed. If you want to get the statistics of a particular port, select the port from the list of ports.
The following image shows the ASN port statistics page:
Port: The name of the port.
Rx Packets: The number of received packets.
Rx Drop: The percentage of packets dropped.
Port: The name of the port.
Rx Packets: The number of received packets.
Rx Drops: The percentage of received packets dropped.
Deep Packet Inspection (DPI) is a powerful technique that analyzes network traffic at the packet level, going beyond basic header inspection to examine the payload of the actual data being transmitted.
Aviz Service Nodes support in-service DPI upgrade for enhanced new DPI library integrations.
The Packet Capture feature allows users to capture network traffic on selected interfaces for analysis. It provides configurable options to define capture duration, file size limits, & interface.
Accessing Packet Capture
Navigate to Configuration > ASN > Packet Capture.
Select the device for which you want to capture packets.
Configure the capture settings as needed.
Capture Duration (ms): Specifies the duration in milliseconds for which packet capture will run. The value can range from 1 to 10,000 ms..
Capture File Size Limit (MB): Defines the maximum file size for the captured packets before it stops capturing. The value can range from 1 to 1,000 MB.
Capture Interface Config: Allows selecting the interfaces (ports) from which packets will be captured, supporting both received (RX) and transmitted (TX) traffic.
Configure the desired settings.
Click the Start Packet Capture button to begin capturing network traffic.
Below image show the Packet Deduplication for Full Packet
Packet capture will stop on all configured ports if the cumulative file size or capture duration limit is reached on any port.
Captured PCAP files are stored in the ASN server at /var/log/ and can be transferred using the Linux SCP command.

GRE Offset Strip Length: Specifies the length of the GRE header to strip from ingress packets.
Application Identification: Enable or disable application identification.
Metadata Export: Enable or disable data export to Kafka.
N11 Packets Processed: The number of N11 packets received.
N4 packets Processed: The number of N4 packets received.
S11 Packets processed: The number of S1-U packets received.
Decap Drops: The number of packets dropped due to decapsulation error.
Metadata Extracted: The number of packets from which metadata has been extracted.
GTP-U Packet Processed: The number of GTP-U packets received.
Metadata Extracted: The number of packets from which metadata has been extracted.
RX/TX File Name: Defines the filenames for received (RX) and transmitted (TX) packets.
Clean Up Old PCAP File: When enabled, previously stored PCAP files will be deleted before capturing new data.


Enable internet and DNS to install packages via Ubuntu apt
Extract the image tar -xf asn-image-v*.tar.gz
Change to the extracted directory cd asn-image-v*
Run the installation script for the ASN server
ASN can operate in two modes: Application mode and Subscriber mode. When transitioning between these modes, follow the steps below carefully to ensure a clean restart.
Step 1: Stop Existing ASN Services
Run the following commands to stop all active ASN services:
Step 2: Flush Redis Database
Clear the Redis database to remove any residual data before switching modes:
Step 3: Reinstall ASN Server
Run the installation script to ensure the correct mode is set:
Step 4: Start ASN in the Desired Mode
To run ASN in Subscriber mode, execute:
To run ASN in Application mode, execute:
After executing the respective command, ASN will initialize in the selected mode.
If any prerequisite or dependency is installed after completing the ASN installation, the following script must be re-executed:
Extract the image tar -xvf asn-generic-image-v2_3-20260112.tar.gz
Change to the extracted directory cd asn-core-install/
Run the installation script for the ASN server sudo ./install-asn-server-rhel.sh
To view the Global statistics of a Node from the FlowVision GUI, click Statistics > ASN>Global.
The page shows the following metrics:
Total User Sessions: Indicates the total number of active user sessions on the Service Node.
Total Subscriber: Reflects the total subscribers registered on the service node.
To view the Kafka Export statistics of a Node from the FlowVision GUI, click Statistics > ASN>Kafka Export
The page shows the following metrics:
C-Plane Data: Indicates the total number of C-Plane data export Counts from ASN Node.
Priority C-Plane Data: Indicates the total number of Priority C-Plane data export Count from ASN Node.
U-Plane Data: Indicates the total number of U-Plane data export Count from ASN Node.
Priority U-Plane Data: Indicates the total number of Priority U-Plane data export Count from ASN Node
Deduplication statistics provide insights into the number of duplicate packets identified and dropped. This helps in optimizing network traffic by ensuring only unique packets are process
To view the statistics of a Node from the FlowVision GUI, click Statistics > ASN>Kafka Export
To view the deduplication statistics:
Navigate to Configuration > ASN > Deduplication.
The statistics page displays details of deduplication activity for each device and its associated ports.
The deduplication statics page has following fields:
Device: The IP address of the device processing the packets.
MAC Address: The MAC address of the device processing the packets.
Port: The interface on which the packets were received.
The following image shows the deduplication statistics page
The help page takes you to the REST API documentation. To get to the REST API from the FlowVision GUI, click Help > REST API.
This action takes you to the Swagger UI page with the FlowVision REST API.
To configure and manage system attributes of ASN via the FlowVision GUI, navigate to:
Configuration > Systems.
The Systems Manager page displays the configurations for Kafka, SNMP, NTP, and Syslog servers, allowing users to add or remove associated IP addresses as needed.
The following image shows the System Parameters page:
Configure and manage up to one Kafka server IP address for exporting metadata extracted by the Service Node.
Configure and manage up to three SNMP trap server IP addresses for receiving SNMP traps generated by the Service Node.
Configure and manage up to three NTP server IP addresses for time synchronization.
Configure and manage up to three Syslog server IP addresses for receiving system logs from the Service Node.
Set thresholds for SNMP traps based on the following parameters:
Disk Usage (%): Define a trigger when disk utilization exceeds a specified percentage.
CPU Usage (%): Set a threshold for CPU utilization percentage.
Temperature (℃): Configure the ASN appliance temperature limit before an SNMP trap is triggered.
To check the ASN module status in the Server directly, use the below commands:
xxx@metasrv01:~/Code/Beta/Package/metadata-appliance$ asncli
You can use the below command to collect-tech-support data
Submitting a Ticket at https://support.aviznetworks.com/hc/en-us/requests/new
Live Chat on https://support.aviznetworks.com
A ticket can be submitted with or without an account at the support portal
Mandatory Fields:
Subject
Issue Type (Post Deployment, Pre-Deployment, General Query, RMA)
Priority (Low, Normal, High, Urgent)
Description
Optional Fields:
External ID (Community Request ID or Past Case Number)
Hardware (Switch Model)
ASIC vendor (chipset)
Serial Number
Host Name
Attachments (Tech Support Dump, Screenshots, Logs)
For Technical Issues, we recommend the description include the following:
Repro steps, if the issue is reproducible
The sequence of events that lead to the failure state
Artefacts - Tech Support dump (tar.gz file), Logs, Command Outputs, Topology Diagrams etc...
Reboot the server sudo reboot
After rebooting, install DPDK ports install-dpdk-ports.sh
Set the core allocation for Kafka and KPI value in FV boot configuration page.
Execute the ASN script sudo ./run-asn.sh to run ASN in Subscriber mode
Execute the ASN script sudo ./run-asn.sh --mode=DC to run ASN in Application mode
Use the FV GUI to control/manage ASN
To check the Dev console of ASN-Server
sudo conspy 20
Press ESC three times to exit
Reboot the server sudo reboot
After rebooting, install DPDK ports incase of intel NIC connection install-dpdk-ports.sh
Set the value of hugepage in the shell script install-asn-hugepages.sh example huge_page=150
Run the hugepage script sudo ./install-asn-hugepages.sh
Verify the hugepage config sudo dpdk-hugepages.py -s
Change to directory cd asn-core-install/
Set the core allocation for Kafka and KPI count, total ports, overall core in FV boot configuration page.
Execute the script sudo ./run-asn-rhel.sh --nic=All --mode=DC to run ASN in Application mode
Execute the script sudo ./run-asn-rhel.sh —nic=All to run ASN in Subscriber mode
To check the Dev console of ASN-Server
sudo conspy 20
Press ESC three times to exit
asncli#
  collect-tech-support  Collect the tech support info and Create tar file
  exit                  Exit from the Current Prompt
  quit                  Quit to Enter Native Linux Shell
  show                  Show Commands


asncli# show
  kafka-config          ASN Kafka Config
  module                ASN Modules
  version               ASN Version

asncli# show kafka-config
==================================================================
ASN Kafka Config
==================================================================
Kafka Export Status : on
Kafka Server List   : 10.4.5.227:9092
Kafka Interval Time : 30
asncli#

asncli# show module status
Calculating ASN Module Status
==================================================================
Module               Status          CPU %           MEM %
==================================================================
asn-rest-server      active          0.5             40.5MB
asn-mgmt             active          0.1             15.4MB
asn-core             active          17.2%           14.7GB
asn-snmp-trap        active          0.0             18.1MB
asncli#

asncli# show  version
ASN-V2.0-20250313
asncli#asncli# collect-tech-support
ASN Techsupport Collection Started
Tech Support Collection Success - /etc/log_asn/asn_techsupport_20240725_025100.tgz
asncli#sudo systemctl stop asn-core
sudo systemctl stop asn-mgmt
sudo systemctl stop asn-snmp-trap
sudo systemctl stop asn-rest-serverredis-cli "flushall"./install-asn-server.shsudo ./run-asn.shsudo ./run-asn.sh --mode=DCDeduplication Drops: The number of duplicate packets dropped out of the total received packets.
Errors While Processing: Indicates any errors encountered during the deduplication process.
FAN RPM (%): Set a limit for fan speed in Revolutions Per Minute (RPM).


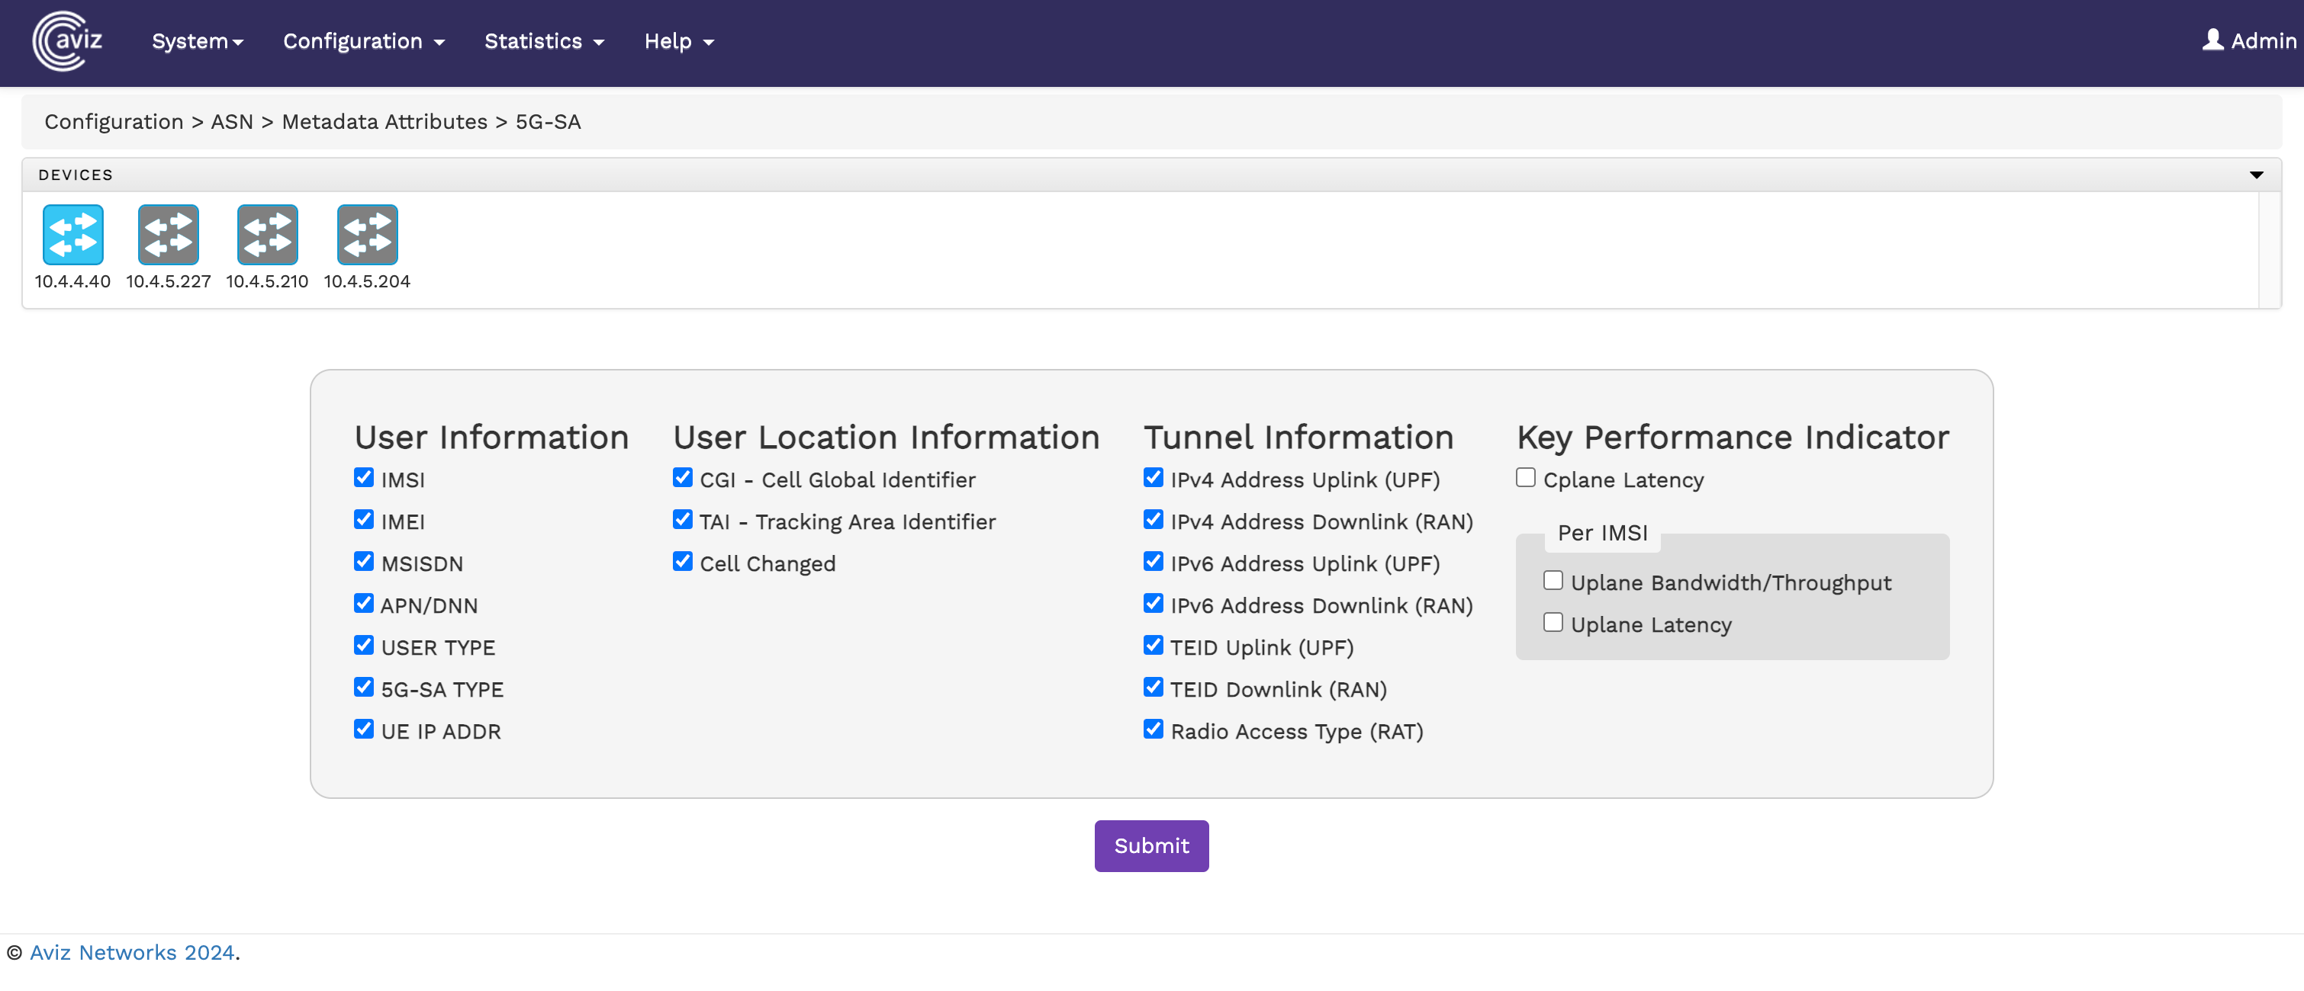

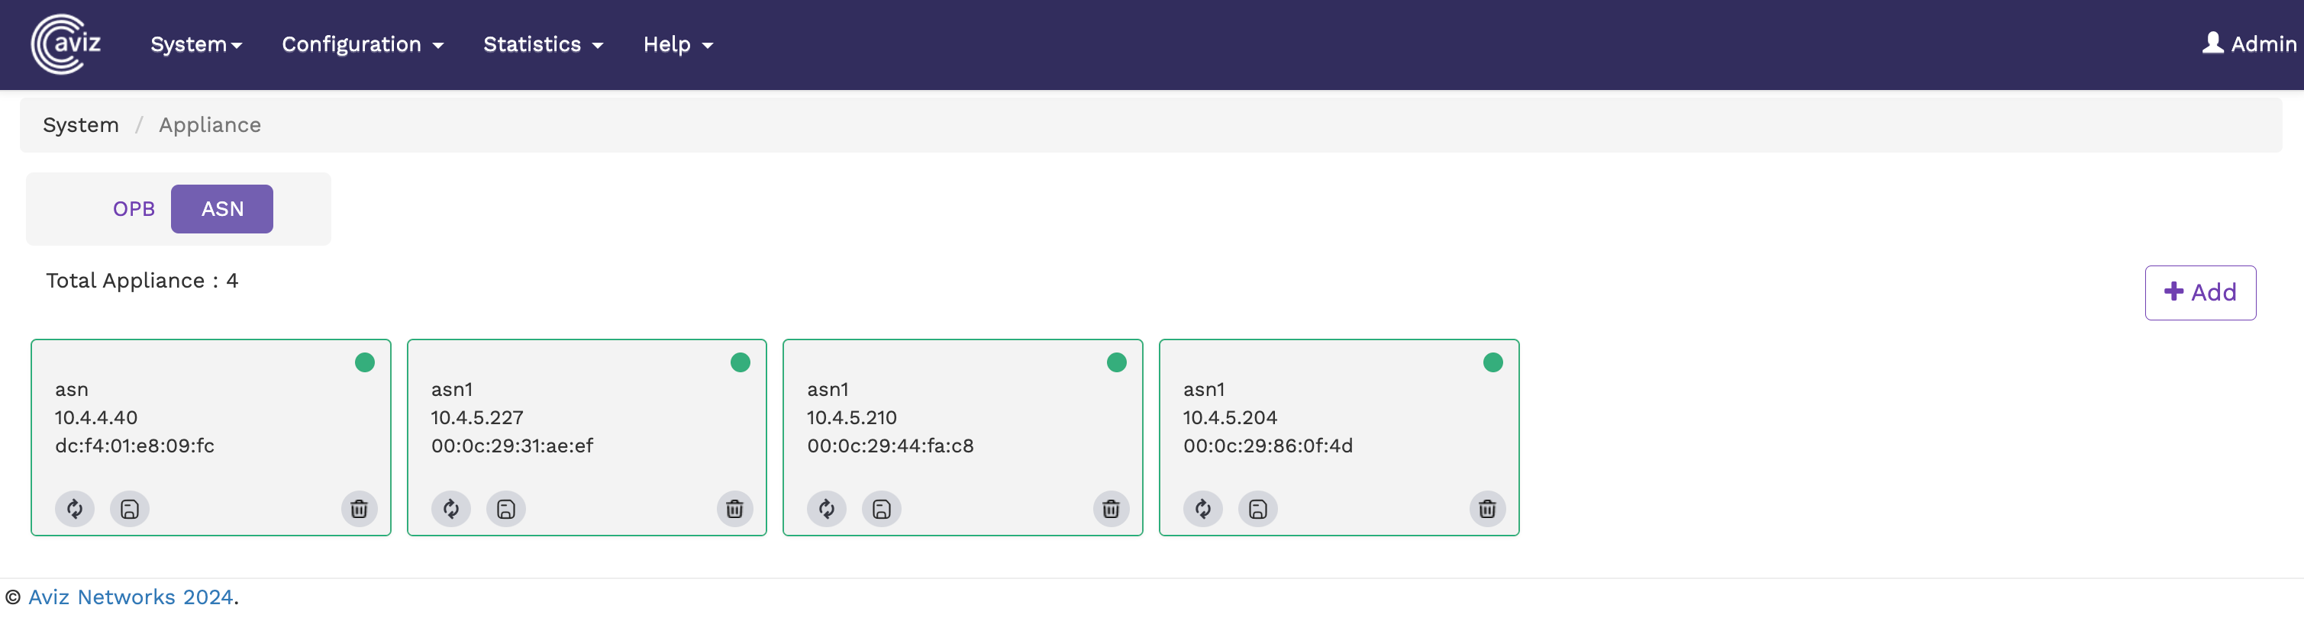

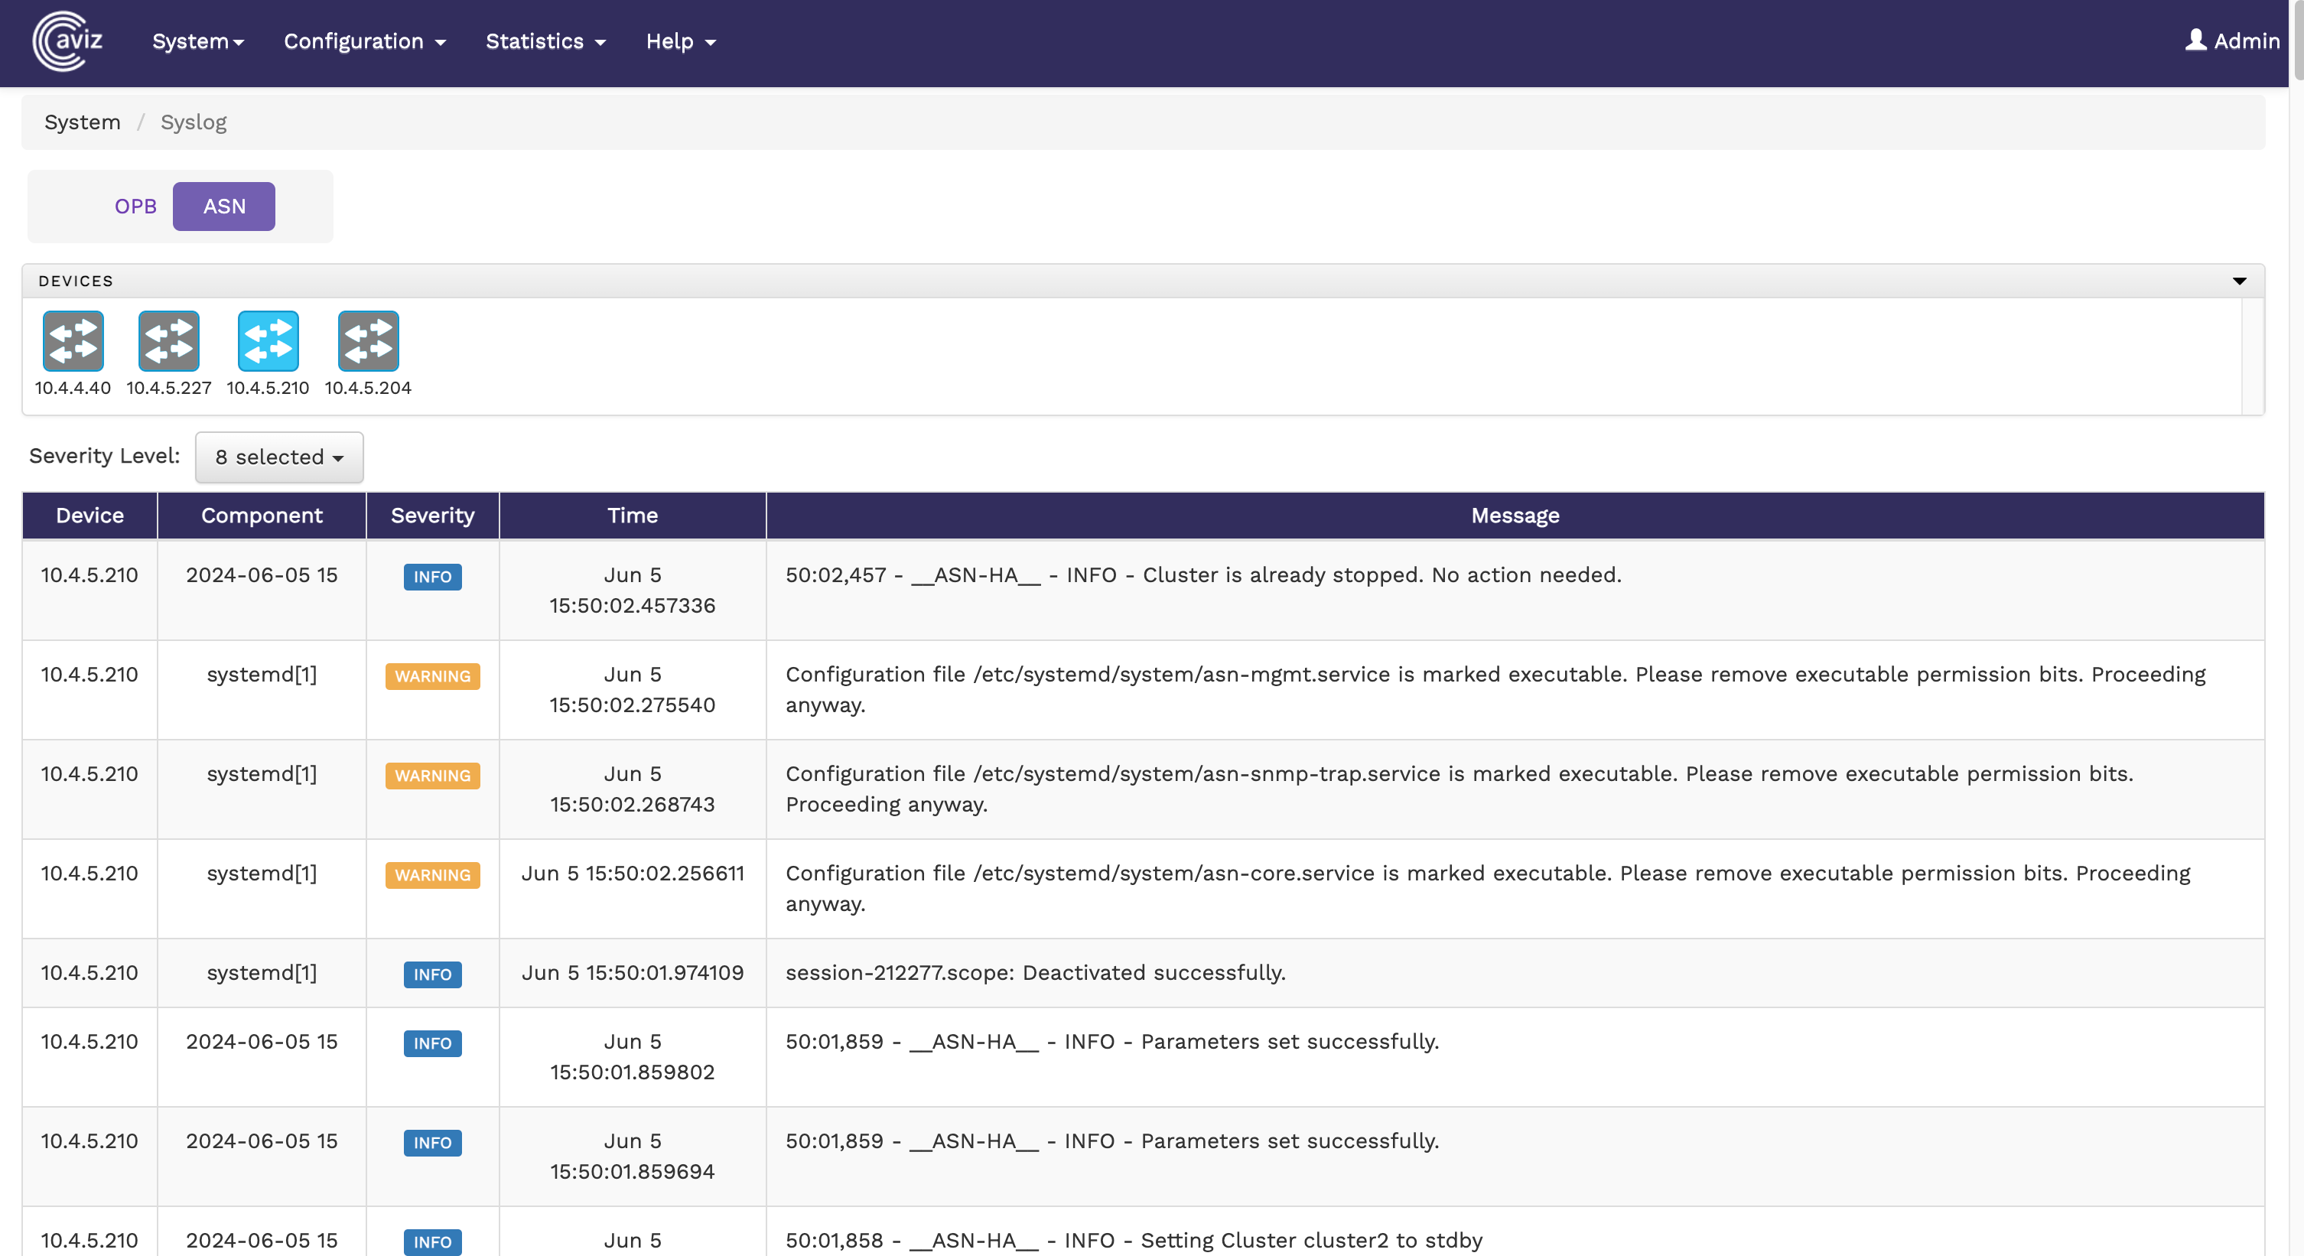
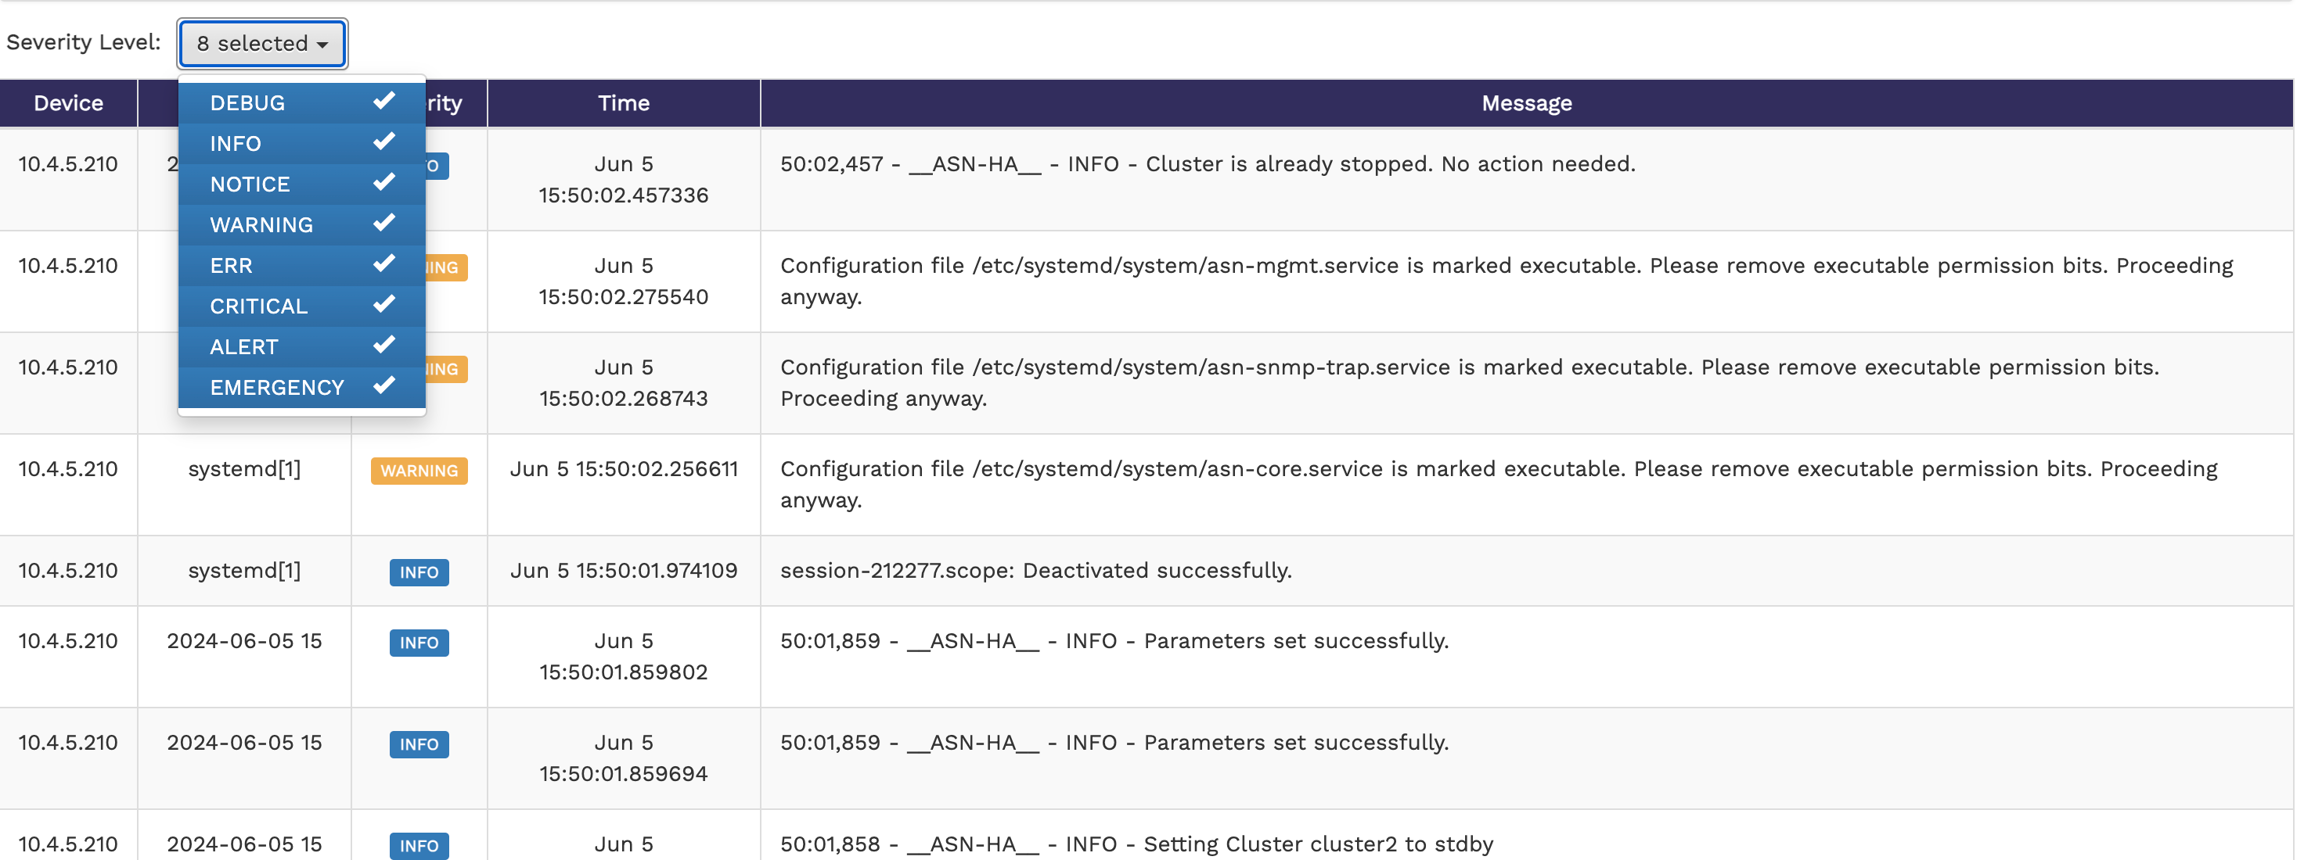


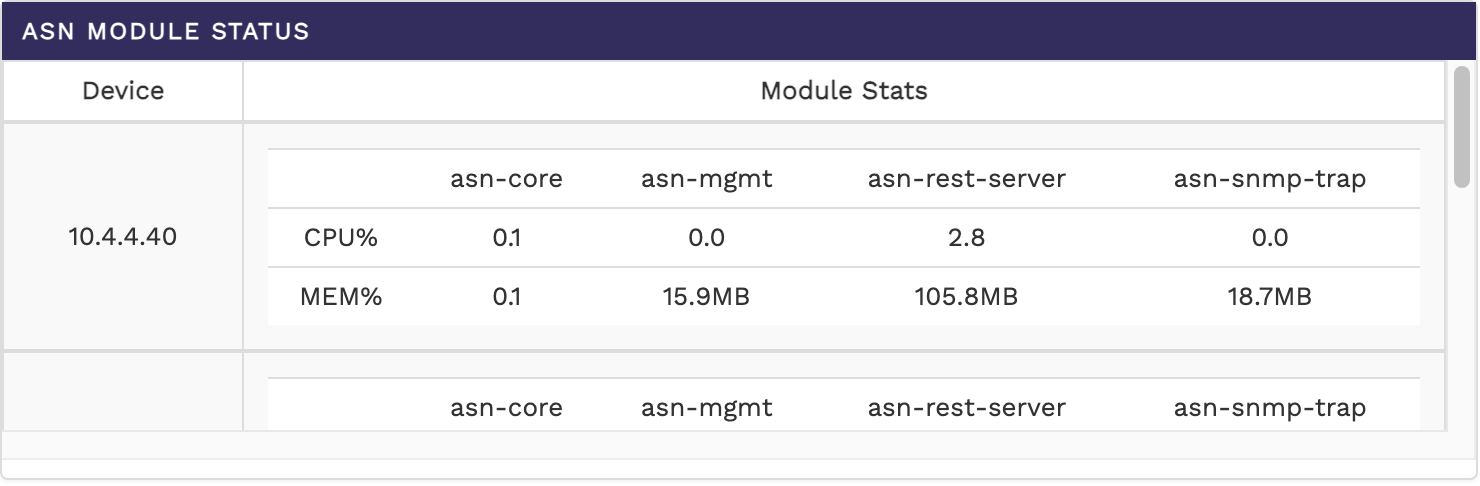


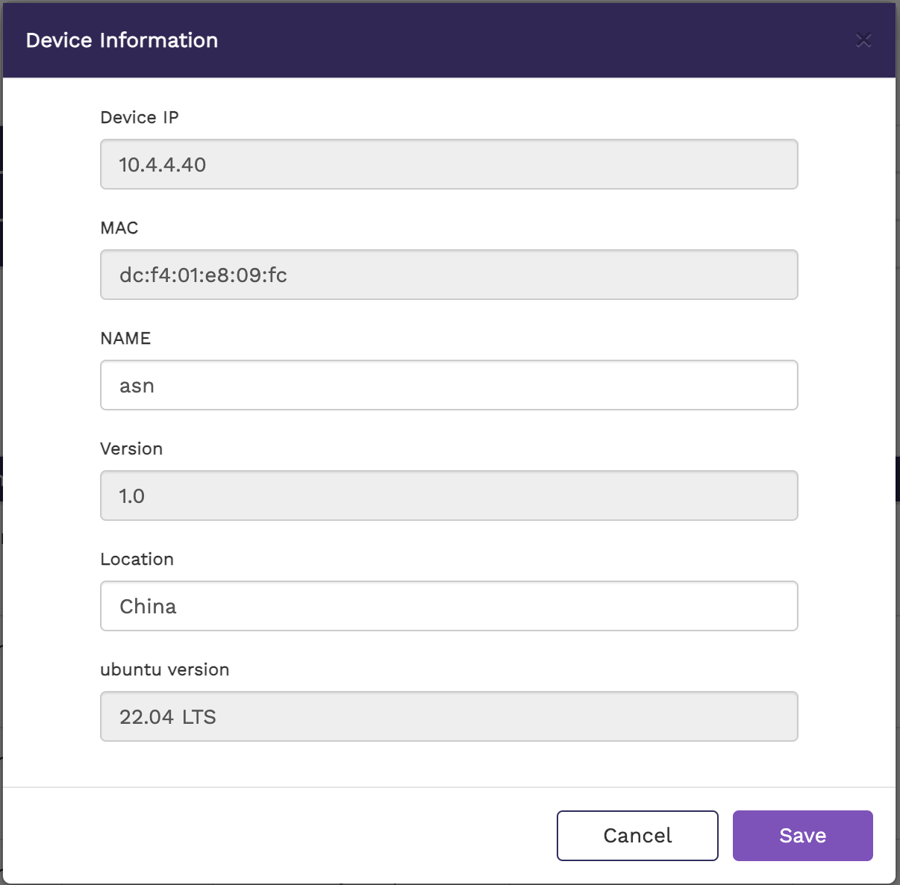
Packet deduplication is a feature used to identify and eliminate duplicate network packets, improving network efficiency and reducing redundant data processing. It works by comparing incoming packets
To configure and manage packet deduplication of ASN via the FlowVision GUI, navigate to:
Configuration > ASN > Deduplication
Deduplication Configuration Options:
Packet Deduplication: Toggle this option to enable/disable deduplication.
Selecting the Packet Source, you can choose one of the following packet sources:
Full Packet: Deduplication is applied to the entire packet.
Routed Packet: In real time, the packets can be routed across multiple devices/hops. Hence there are chances the duplicate packets can be received to monitoring fabric with different Src MAC/TTL/Checksum fields.
Anchor : Determines the starting position for packet comparison during deduplication. Available options:
Packet Start – Begins deduplication from the start of the packet.
L3 Start – Uses the Layer 3 (network layer) header as the reference point.
Offset: Define the byte offset from the anchor point where deduplication begins till the provided bytes (14 to 128 bytes)
Window Size: The time interval within which duplicate packets will be identified. Available options: 2,4,6 & 8ms.
Deduplication Interface: Select the network interface where deduplication should be applied.
Below image show packet deduplication for full packet
Below image show the Packet Deduplication for Routed Packet
When the Routed Packet option is selected, users can exclude the following fields from packet deduplication:
Ignore IPv4 TTL: Ignores changes in the TTL (Time-To-Live) field for IPv4 packets.
Ignore L2 Header: Excludes Layer 2 (Ethernet) header fields from deduplication.
Ignore IPv4 Checksum: Ignores differences in IPv4 checksums when comparing packets.
Packet drop for a few milliseconds is expected during configuration changes as the deduplication module reinitializes.
The deduplication feature operates in DC mode.
L4 Payload – Focuses on the Layer 4 payload for identifying duplicates.