Loading...
Loading...
Loading...
Loading...
Loading...
Loading...
Loading...
Loading...
Loading...
Loading...
Loading...
Loading...
Loading...
Loading...
Loading...
Loading...
Loading...
Loading...
Loading...
Loading...
Loading...
Loading...
Loading...
Loading...
Loading...
This guide provides you with information on how to use the FlowVision graphical user interface to manage devices.
The FlowVision GUI has the following menu options at the top level:
FlowVision uses TCP port 443 for its Web-GUI and TCP port 8091 for communication with the OPB switches.
The following image shows the home page of the Aviz FlowVision GUI:
The System menu lets you perform the following actions:
The FlowVision Controller can be installed using the following methods:
An ESXi Host with the below minimum requirement available for FlowVision:
2 vCores
4 GB RAM
20 GB HDD
Log in to the ESXi Host and click on 'Create/Register VM'
Click on 'Deploy a virtual machine from an OVF or OVA file'
Name the VM and select the downloaded 'OVA' file
Choose the 'datastore' where you want to install the VM
Select the 'VM-Network' to ensure that the VM is reachable
Review the configuration and click on 'FINISH'
Wait for the OVA file to upload; Check the status in 'Recent tasks' at the bottom of the screen
'Power on' the VM
Login to the VM with default credentials
User: aviz
Password: Aviz@123
Check DHCP assigned IP on the VM with 'ip a'
Login to the Web-GUI at https://<VM-IP>/ with default credentials
User: admin
Password: admin
A Windows machine/VM with the below minimum requirement:
2 vCores (available for FlowVision VM)
8 GB RAM
40 GB HDD
Download Oracle VM virtual box from the below link
Install Oracle VM Virtual box
Import the OVA file in Oracle VM virtual box
Click the start button to power-on the virtual machine
Log in to the FlowVision VM with default credentials
Username: aviz
Password: Aviz@123
Get the IP address of the VM through ip address show
Access the GUI through the above IP using your favourite browser with http port: 8093
https://<VM_IP>:8093/
Login to the GUI with the default credentials
Username: admin
Password: admin
The Dashboard is the default home page of the FlowVision GUI. To return to the dashboard view from any other page, click System > Dashboard.
The Dashboard shows you the following data:
This pie chart shows you the device information based on HwSKU and the device OS. You can hover the mouse pointer over the charts to display a tooltip with more relevant information.
The following image shows the OPB fabric information charts:
The platform health table shows you the CPU usage, memory availability, and link status for each connected devices. From this data you can infer the overall health of the platform.
The following image shows the platform health table:
The link information table shows you the total number of ports from all the connected devices, the number of ports that are enabled with admin privileges, and the number of ports that are connected at any given moment.
The following image shows the link information table:
The top 5 ports by traffic shows you the top 5 ports across all connected devices sorted on the basis of their traffic rate. The table shows you the device, port number, the number of In Ucast packets, the number of Out Ucast packets, the number of In Discards, and the number of Out Discards.
The following image shows the top 5 ports by traffic table:
The top 5 devices by Flow shows you the top 5 devices sorted on the basis of the number of flows they have. The table shows the device IP, the number of flows, and the number of rules.
The following image shows the top 5 devices by flow table:
The top 5 flows by traffic shows you the top 5 flows across all connected devices sorted on the basis of their traffic rate. The table shows you the device IP, flow alias, and the count.
The following image shows the top 5 flows by traffic table:
The docker statistics table shows you the docker statistics across all connected devices along with the CPU and memory usage for each device.
The following image shows the docker statistics:
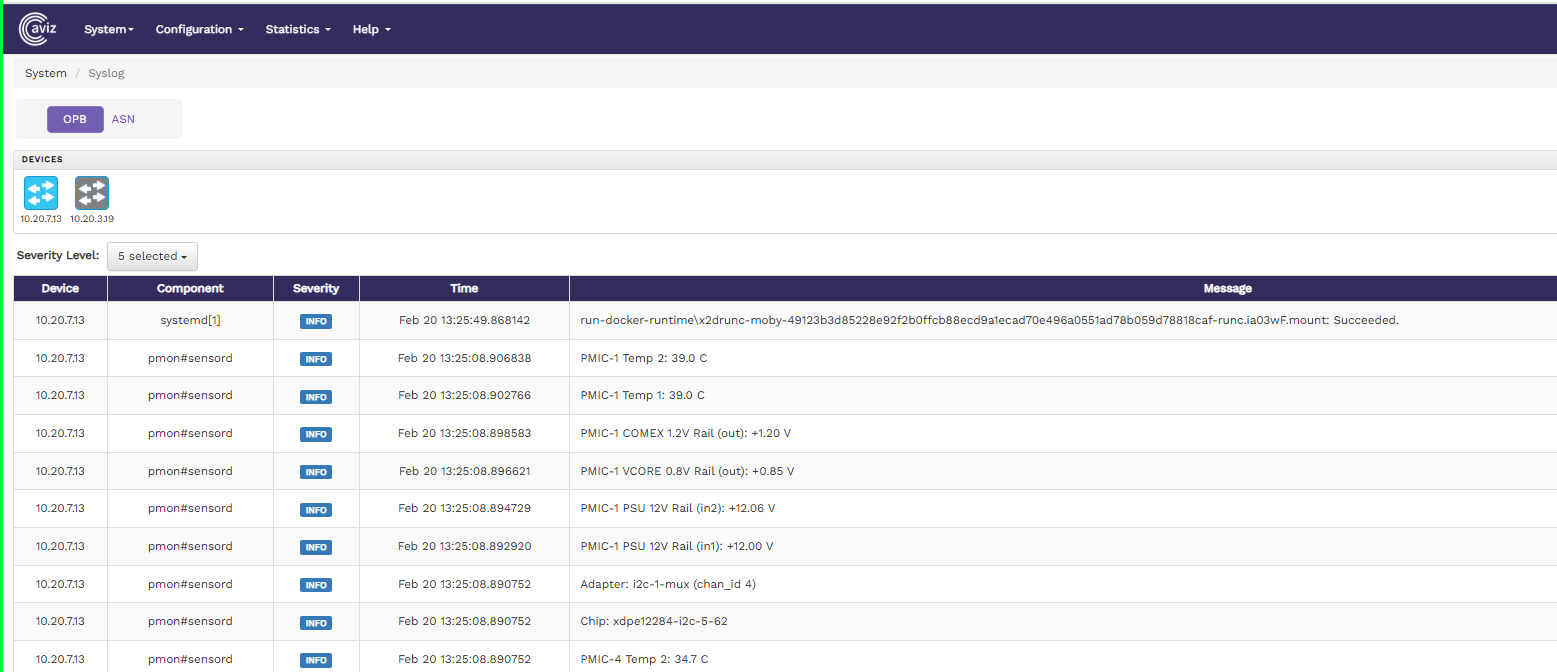
The syslog statistics table shows you the system log statistics of all connected devices. The table shows the number of messages in the info, debug, error, notice, and warning categories for each device.
The following image shows the syslog statistics:
To manage connected topologies from the FlowVision GUI, click System > Topology.
The topology screen shows all the connected devices. The devices that are online are shown in green and the devices that are offline are shown in red. Hover the mouse pointer over the device icons to get more information, such as, the IP address, RAM, CPU, SSD, and so on.
The following image shows the topology of devices in the FlowVision GUI:
You can change the device properties, refresh a device, or delete a device by accessing the Device Control window from the topology page.
Click the device icon in the topology screen. The Device Controls window displays.
Click the icon at the bottom of the Device Controls window. The Device Properties window displays.
Drag the sliders to the desired point to configure the threshold values for CPU, RAM, and SSD.
Click Save changes to apply your changes.
Other than changing the device properties, you can also reboot a device or delete it from the Device Controls window:
Click the icon to reboot the device.
Click the icon to delete a device.
If you open the Device Controls window of a device shown in red in the topology screen, you cannot configure the device properties, as the device is not reachable. You have an option to remove the device, if need be. Click the REMOVE button to remove the device.
To view the system log from the FlowVision GUI, click System > Syslog.
The Syslog page shows the system logs of all the devices that are online. You can click the device icon for each of the online devices to get the system log for that particular device. The system log shows the device IP, component, severity level, time stamp, and the severity level message with more specific information.
The following image shows the system log table of a device:
You can change the severity level of the messages displayed in the syslog table using the Severity Level drop-down menu. The available options are Debug, Info, Notice, Warning, Err, Critical, Alert, and Emergency. This is a multi-select menu where you can select multiple severity levels to be displayed.
To access the system and device information, click System > General.
The system information table shows you the product name, version information, and technical support information for the system.
The following image shows you the system information tab:
The devices information table shows detailed information and properties of each connected device. For each device, the table shows the IP address, the MAC address, the platform on which the device is running, the HWSKU information, the SONiC version of the device, the PBNOS version, and the device uptime in days, hours, and minutes.
You can edit device properties from the Devices Information table:
Change the required device property value in the editable fields. Currently, you can edit the Hostname, ZTP Status, and GTP value.
Click Save Changes to apply your changes.
Click the Reboot Device button, if you want to reboot the device.
To manage connected devices from the FlowVision GUI, click System > Devices.
The Devices screen shows all the connected devices and their connection status. The devices that are online are shown with a green status and the devices that are offline are shown in a red status. You can click the icon to reboot an online device. To delete a device, click the icon.
The following image shows the Devices page:
To add a new device,
Specify the values for IP Address, Username, and Password in their respective fields.
Click Save to apply your changes and add the device. Click Discard to discard your changes.
Click the Edit button corresponding to the required device on the Devices Information table. The Device Properties window displays.
Click the icon at the top right corner of the Devices page. The Add New Device window displays.
To manage users from the FlowVision GUI, click System > User Management.
The User Management page shows the details of all the users of the system and their user previleges and roles. From the User Management page, you can add new users, edit user roles and permissions, de-activate a user, and delete a user.
You must have admin previleges to add, edit, or delete a user.
The following image shows the User Management page:
To add a new user,
Specify the Email address, Username, Password, and Role of the new user in their respective fields. The Role drop-down field has two options - Admin and Viewer. The Admin role has full access and the Viewer role has read-only access.
Click Save to create the user.
To edit an existing user,
Edit the required details in the Email, Username, Password, and Role fields.
Click Update User to update the user details.
In the User Management table,
Click the De-Activate button to deactivate a user.
Click the Delete button to delete a user.
To perform backup and restore from the FlowVision GUI, click System > Backup/Restore.
The Backups page shows the available backup files of the system. The details include the backup filename, the date of backup creation, the status of the backup and the option to delete a specific backup file.
The following image shows the Backups page:
To create a new backup, click the Create Backup drop-down menu and select Create Backup.This action creates a new backup file and its status is displayed in the Backups table.
You can also have the option to selectively backup the database or the FlowVision system. To perform this selective backup,
Select the backup you want to create. The available options are - Backup DB and Backup FlowVision. This is a multi-select option where you can choose either or both.
Click Backup to create the selected backup.
You can upgrade the FlowVision system if required. To upgrade,
Select the Upgrade FlowVision checkbox.
Click Upgrade to upgrade the system.
Click the ADD button on the header of the user management table at the top. The New User window displays.
Click the Edit button against the user in the User Management table. The Edit User window displays.
Click Create Backup > Create Backup (Advanced). The New Backup window displays.
Click Upgrade System on the top right corner of the Backups page. The Upgrade System window displays.
To delete a specific backup file, click the icon against the corresponding backup file in the Backups table. Confirm the delete action in the Confirm Delete prompt.
The configuration menu helps you perform the following:
The Tunnel Configuration section in FlowVision allows users to view, create, and manage VXLAN tunnels through a graphical interface.
To view and configure Vxlan tunnel:
Navigate to Configuration > Tunnel.
The Tunnel Information page displays:
Existing VXLAN tunnels.
A table with tunnel details, including:
Tunnel Name
Tunnel Source IP
Tunnel Destination IP
Underlay Port
Overlay Port
VLAN Tagging
Tunnel Status
Tunnel Stripping
Delete Option
Note:
Only one tunnel can be created per device.
The tunnel name must start with "tunnel".
The following image shows the Tunnel Information page:
To create a new tunnel,
The Tunnel Template window displays.
Specify values for the following:
Name - specify a name for the new tunnel (must start with "tunnel"
)
Description - enter description of the new tunnel to show its purpose.
Tunnel Type - select the tunnel type ,two options are available i.e Encapsulation (Strip VXLAN) or Decapsulation (Decap VXLAN).
Vlan tagging- enable or disable vlan tagging for the tunnel.
Ingress interface - select the ingress tunnel port.
Strip Vxlan Egress - select the egress tunnel port.
Source IP- specify the source IP for the tunnel.
Destination IP - specify the destination IP for the tunnel.
VNI- specify the VxLAN Network Identifier.
Gateway- enter the tunnel IPv4 gateway address.
3. Click Save to apply the changes.
To view and configure rule templates from the FlowVision GUI, click Configuration > Rule Templates.
The Rule Templates page shows the total number of existing rule templates and a table showing the details of each of these rule templates, such as the name of the template, the action performed, the override action and also an option to edit or delete a rule template.
The following image shows the Rule Templates page:
To create a new rule template,
Specify values for the following:
Name - specify a name for the new rule template.
Description - enter a description of the new rule template to show its purpose.
Action - select an action for the template. The available options are Permit, Deny, Match All.
Type - select the IP address type. Available options are IPV4 and IPV6.
Counters - enable or disable counters.
IP Protocol - select the IP protocol for the template. The available options are - IP, TCP, UDP.
Source IP - specify the source ip for the template.
Source Mask - specify the source mask for the template.
Destination IP - specify the destination IP for the template.
Destination Mask - specify the destination mask for the template.
TTL - specify the time-to-live value for the packets in the system.
VLAN - specify the VLAN details.
TOS - specify the type of service.
Advanced Action - specify the override actions. The available options are override-push-vlan, override-pop-vlan, and None.
3. Click Save to apply the changes.
You can group ports from a device together and create port groups. To get to the port groups page from the FlowVision GUI, click Configuration > Port Groups.
The Port Groups page shows you the connected devices and a table that shows the port groups from each device, the port group ID, the name of the ports that are part of the port group and an option to delete any existing port group.
The following image shows the Port Groups page:
To create a new port group,
Select the device where you want to create the port group.
Click the required ports to add them to the port group. The added ports are displayed in the Select ports to create Groups field.
Specify a number i.e. say 1 to 15, for the port group in the Port Group Id field.
Click Save.
To view the audit logs from the FlowVision GUI, click System > Audit Logs.
The audit logs table gives you the details of all the actions performed on the connected systems. The details include the action performed, the date, the IP address of the system, the resource used, the username of the operator that performed the action, and the status of the action.
The following image shows the audit logs table:
To configure the ports of the connected devices from the FlowVision GUI, click Configuration > Ports.
The Ports page shows the connected devices, the ports of each of those connected devices, and a table displaying the details of the ports, such as, the admin status, link status, speed, ingress VLAN, egress tagging, truncation, mode, and the tranceiver details. Note that, the ports that have their link status as 'UP' are shown in green, whereas the ones with the link ststus as 'DOWN' are shown in red. You can hover the mouse pointer over the devices icon or ports icon for more information on that device or port.
By default, when you select a device in the Devices section, the ports table shows you the details of all the ports of the selected device. If you want to get the details of particular ports, click the port number in the Ports section. You can also edit the properties of ports from the ports table.
The following image shows the ports page with device, ports, and port status details:
To edit the properties of a port,
Click the Edit button against the required port in the ports table. The Port Properties window displays.
Update the properties as required. The properties you can update are - Description, MTU, Speed, Admin Status, Ingress VLAN, Egress Tagging, Truncate, Mode, Fec , Port Type, Loopback Mode, Auto Neg, LLDP, sFlow and Switch Port Vlan. You can also see other non-changeable fields with more information about the selected port.
Click Save Changes to apply your changes.
To view the port statistics of the connected devices from the FlowVision GUI, click Statistics > Port.
The Ports statistics page shows you the connected devices, the available ports on each device, and the counter, traffic rate, and error statistics of the ports. By default, when you select a device the statistics for all the ports in the device are displayed. If you want to get the statistics of a particular port, select the port from the list of ports.
The following image shows the port statistics page:
You can get the statistics for Counters, Traffic Rate, and Errors, each shown in a different tab.
The counter statistics show the counter for received bytes, received packets, transmitted bytes, and transmitted packets for each port.
The following image shows the counter statistics table:
The traffic rate statistics show the rate of transmission and reception in bytes for each port.
The following image shows the traffic rate statistics table:
The error statistics show the In Errors, Out Errors, In Discards, and Out Discards of each port.
The following image shows the error statistics table:
The VLAN Configuration section in FlowVision allows users to create, manage, and delete VLANs through a graphical interface.
To configure VLANs from the FlowVision GUI:
Navigate to Configuration > VLAN Configuration.
The Vlan Configuration page will display:
The total number of existing VLANs.
A table with VLAN details, including Device IP, Interface Type, Ip Address/ Mask ,Any Cast Gateway / mask and options to Delete VLANs.
The following image shows the VLAN Configuration page:
To add a new Vlan,
Enter a VLAN ID within the supported range (4010–4060).
Once created, the new VLAN will be listed under the VLAN Information section.
To assign an IP address to the newly created VLAN:
Select Interface Type: VLAN from the dropdown menu.
Choose the VLAN ID, assign the IP address, and click Save.
The newly created SVI (Switched Virtual Interface) will appear in the Interface VLAN Information table as show on below
Note: Removing an SVI requires deleting the associated VLAN. There is no option to delete only the SVI while retaining the VLAN.
To view the flow statistics of the connected devices from the FlowVision GUI, click Statistics > Flow.
The Flow statistics page shows you the connected devices, the available rule IDs for each devices, the flow alias, and counters.
The following image shows the Flow statistics page:
To create and configure flows from the FlowVision GUI, click Configuration > Flow Manager.
The Flow Manager page shows the number of existing flows and a table showing the flow details, such as device ID, alias, description of the flow, status, the available counters, the action performed, and an option to edit and delete flows.
The following image shows the Flow Manager page:
Specify the Flow Name, Description for the Flow, and select the Action.
To add source ports
Click the Network Ports button on the Add Flow page. The Add From Ports window will appear as below
Select a device to list all the ports available for that device.
Select the ports you need to add as source ports.
Click Add to include the selected ports in the source ports list. The added ports are displayed in the field below the Network Ports button on the Add Flow page.
To add source ports as Vxlan Tunnel for Vxlan Decapsulation
To configure a VXLAN tunnel as a source port for VXLAN Decap:
Set the Flow Type to VXLAN Decap as shown below.
Click Network Ports button on the Add Flow page.
The Add From Ports window will appear.
Select a device to list the available Vxlan tunnel for that device.
Choose the VXLAN tunnel you want to add as a source port.
Click Add to add the tunnel to the list of source ports.
The added tunnel will be displayed in the field below the Network Ports button on the Add Flow page.
To add rules,
Click the Rules button on the Add Flow page. The Add Rule window displays with GTP disable.
The Add Rule window displays with GTP enable.
Specify values for the following, in the Rule tab:
Rule ID - specify a name for the new rule.
Description - enter a description of the new rule to show its purpose.
Action - select an action for the rule. The available options are Permit, Deny, Match All.
Type - select the IP address type. Available options are IPV4 and IPV6.
GTP - enable or disable the GTP-based filter option on a rule, when gtp enable provide GTP IP Type, Match All, TEID, Inner Protocol, Inner Source IP, Inner Source IP Mask, Inner Destination IP and Inner Destination IP Mask to match upon.
Counters - enable or disable counters.
IP Protocol - select the IP protocol for the rule. The available options are - IP, TCP, UDP,RSVP,GRE,SCTP and other. if you select others then we must provide protocol number.
Source IP - specify the source IP for the rule.
Source Mask - specify the source mask for the rule.
Destination IP - specify the destination IP for the rule.
Destination Mask - specify the destination mask for the rule.
TTL - specify the time-to-live value for the packets in the system.
VLAN - specify the VLAN details.
TOS - specify the type of service.
Override To Ports - select the override option for ports.
Advanced Action - specify the override actions. The available options are override-push-vlan, override-pop-vlan, and Overwrite. If you select override-push-vlan, you must also provide the VLAN ID, in the VLAN ID field. And if you select Overwrite ,then you must provide Destination IP or Destination mac or Destination Port.
Click Add to add the rule.
The added rules are displayed in the table below the Rules button on the Flow Manager page.
To add destination ports,
Click the Tool Ports button on the Add Flow page.
The Add To Ports window displays.
Select a device to list all the ports available for that device.
Choose the ports you want to add as destination ports.
Click Add to include the selected ports in the destination ports list.
The added ports are displayed in the field below the Tool Ports button on the Add Flow page.
To add destination ports as Vxlan Tunnel
To configure a VXLAN tunnel as a destination port:
Set the Flow Type to VXLAN Encap.
Click Tool Ports button on the Add Flow page.
The Add To Ports window will appear.
Select a device to list the available Vxlan tunnel for that device.
Choose the VXLAN tunnel you want to add as a destination port.
Click Add to include the selected tunnel in the destination ports list.
The added tunnel will be displayed below the To Ports button on the Add Flow page.
After adding the source ports, destination ports, and rules, click Create Flow on the Add Flow page. This action creates a new flow.
To configure SNMP traps using the FlowVision GUI, navigate to Configuration > SNMP Traps.
The SNMP Traps configuration page lists connected devices and their respective configured SNMP Traps. You can select individual devices and define SNMP traps.
The following image shows the SNMP Trap page with the switches and configured SNMP Traps:
To create an SNMP Trap,
Configure the SNMP trap Server-ID, Version, Destination IP, Destination Port and community string
SNMP Trap is now configured
Click the icon at the top right corner of the Tunnel page.
To delete a tunnel, click the icon next to the tunnel entry.
Click the icon at the top right corner of the Rule Templates page. The Rule Template window displays.
To edit an existing rule template, click the icon and make your changes in the Rule Template window.
To delete a rule template, click the icon.
Click the icon at the top right corner of the port groups page. The Port Group window displays.
Click the icon at the top right corner of the Vlan Configuration page..
Click the second icon in Interface Configuration section.
To delete the existing Vlan , click the icon.
To create a new flow, click the button on the top right corner of the Flow Manager page. The Add Flow page displays.
Specify values in the Template tab. Either specify the rule options in the first tab or select the pre-defined template on the second tab. For details on the template, refer to
To edit an existing flow, click the icon and make your changes in the flow page. Once the modification is done, click the update button
To delete the existing flow, click the icon.
Start by clicking on the button
Select the switch to configure the SNMP Trap
Click on
To delete the existing SNMP Trap, click the icon.
The Statistics menu helps you perform the following:
The Help page takes you to the REST API documentation. To get to the REST API from the FlowVision GUI, click Help > REST API.
This action takes you to the Swagger UI page with the FlowVision REST API.