arrow-left

All pages
gitbookPowered by GitBook
1 of 9

Loading...

Loading...

Loading...

Loading...

Loading...

Loading...

Loading...

Loading...

Loading...

Accessing System and Device Information

To access the system and device information, click System > General.

hashtag
System Information

The system information table shows you the product name, version information, and technical support information for the system.

The following image shows you the system information tab:

hashtag
Devices Information

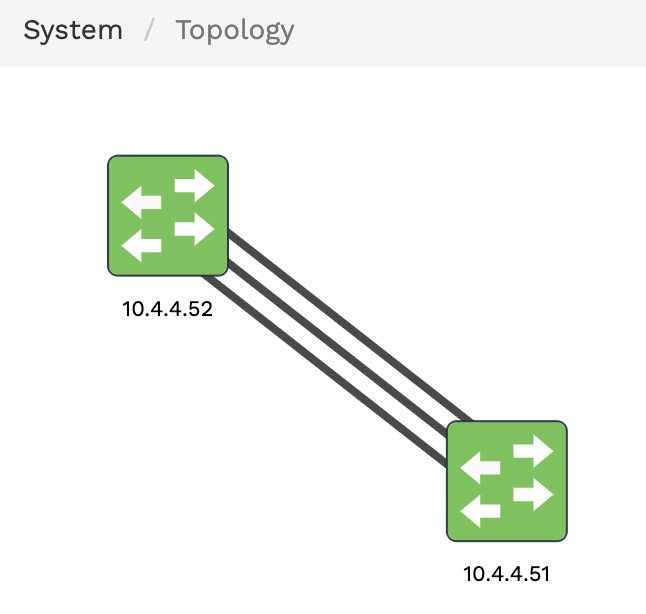
The devices information table shows detailed information and properties of each connected device. For each device, the table shows the IP address, the MAC address, the platform on which the device is running, the HWSKU information, the SONiC version of the device, the PBNOS version, and the device uptime in days, hours, and minutes.

hashtag
Editing Device Properties

You can edit device properties from the Devices Information table:

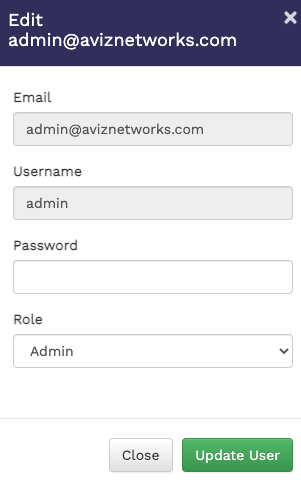
  1. Click the Edit button corresponding to the required device on the Devices Information table. The Device Properties window displays.

  2. Change the required device property value in the editable fields. Currently, you can edit the Hostname, ZTP Status, and GTP value.

  3. Click Save Changes to apply your changes.

Click the Reboot Device button, if you want to reboot the device.

System

The System menu lets you perform the following actions:

Managing Devices

To manage connected devices from the FlowVision GUI, click System > Devices.

The Devices screen shows all the connected devices and their connection status. The devices that are online are shown with a green status and the devices that are offline are shown in a red status. You can click the icon to reboot an online device. To delete a device, click the icon.

The following image shows the Devices page:

hashtag

Managing Topologies

To manage connected topologies from the FlowVision GUI, click System > Topology.

The topology screen shows all the connected devices. The devices that are online are shown in green and the devices that are offline are shown in red. Hover the mouse pointer over the device icons to get more information, such as, the IP address, RAM, CPU, SSD, and so on.

The following image shows the topology of devices in the FlowVision GUI:

Managing Topologies
  • Managing Devices

  • Viewing System Log

  • Managing Users

  • Performing Backup and Restore

  • Viewing Audit Logs

  • Viewing the Dashboard
    Accessing the General System and Device Information
    Adding New Devices

    To add a new device,

    1. Click the icon at the top right corner of the Devices page. The Add New Device window displays.

    2. Specify the values for IP Address, Username, and Password in their respective fields.

    3. Click Save to apply your changes and add the device. Click Discard to discard your changes.

    Devices screen showing connected devices
    hashtag
    Configuring Device Properties in the Topology

    You can change the device properties, refresh a device, or delete a device by accessing the Device Control window from the topology page.

    1. Click the device icon in the topology screen. The Device Controls window displays.

    2. Click the icon at the bottom of the Device Controls window. The Device Properties window displays.

    3. Drag the sliders to the desired point to configure the threshold values for CPU, RAM, and SSD.

    4. Click Save changes to apply your changes.

    Other than changing the device properties, you can also reboot a device or delete it from the Device Controls window:

    • Click the icon to reboot the device.

    • Click the icon to delete a device.

    circle-info

    If you open the Device Controls window of a device shown in red in the topology screen, you cannot configure the device properties, as the device is not reachable. You have an option to remove the device, if need be. Click the REMOVE button to remove the device.

    Table displaying system information
    Table displaying devices information

    Managing Users

    To manage users from the FlowVision GUI, click System > User Management.

    The User Management page shows the details of all the users of the system and their user previleges and roles. From the User Management page, you can add new users, edit user roles and permissions, de-activate a user, and delete a user.

    circle-info

    You must have admin previleges to add, edit, or delete a user.

    The following image shows the User Management page:

    hashtag
    Adding a New User

    To add a new user,

    1. Click the ADD button on the header of the user management table at the top. The New User window displays.

    2. Specify the Email address, Username, Password, and Role of the new user in their respective fields. The Role drop-down field has two options - Admin and Viewer. The Admin role has full access and the Viewer role has read-only access.

    hashtag
    Editing Existing Users

    To edit an existing user,

    1. Click the Edit button against the user in the User Management table. The Edit User window displays.

    2. Edit the required details in the Email, Username, Password, and Role fields.

    3. Click Update User to update the user details.

    hashtag
    De-Activating or Deleting Users

    In the User Management table,

    • Click the De-Activate button to deactivate a user.

    • Click the Delete button to delete a user.

    Performing Backup and Restore

    To perform backup and restore from the FlowVision GUI, click System > Backup/Restore.

    The Backups page shows the available backup files of the system. The details include the backup filename, the date of backup creation, the status of the backup and the option to delete a specific backup file.

    The following image shows the Backups page:

    Backups page showing backup file details

    hashtag
    Creating a New Backup

    To create a new backup, click the Create Backup drop-down menu and select Create Backup.This action creates a new backup file and its status is displayed in the Backups table.

    You can also have the option to selectively backup the database or the FlowVision system. To perform this selective backup,

    1. Click Create Backup > Create Backup (Advanced). The New Backup window displays.

    2. Select the backup you want to create. The available options are - Backup DB and Backup FlowVision. This is a multi-select option where you can choose either or both.

    3. Click Backup to create the selected backup.

    hashtag
    Upgrading FlowVision

    You can upgrade the FlowVision system if required. To upgrade,

    1. Click Upgrade System on the top right corner of the Backups page. The Upgrade System window displays.

    2. Select the Upgrade FlowVision checkbox.

    3. Click Upgrade to upgrade the system.

    hashtag
    Deleting a Backup

    To delete a specific backup file, click the icon against the corresponding backup file in the Backups table. Confirm the delete action in the Confirm Delete prompt.

    Viewing Audit Logs

    To view the audit logs from the FlowVision GUI, click System > Audit Logs.

    The audit logs table gives you the details of all the actions performed on the connected systems. The details include the action performed, the date, the IP address of the system, the resource used, the username of the operator that performed the action, and the status of the action.

    The following image shows the audit logs table:

    Audit Logs table showing the actions performed on the systems

    Viewing System Log

    To view the system log from the FlowVision GUI, click System > Syslog.

    The Syslog page shows the system logs of all the devices that are online. You can click the device icon for each of the online devices to get the system log for that particular device. The system log shows the device IP, component, severity level, time stamp, and the severity level message with more specific information.

    The following image shows the system log table of a device:

    You can change the severity level of the messages displayed in the syslog table using the Severity Level drop-down menu. The available options are Debug, Info, Notice, Warning, Err,

    Viewing the Dashboard

    The Dashboard is the default home page of the FlowVision GUI. To return to the dashboard view from any other page, click System > Dashboard.

    The Dashboard shows you the following data:

    hashtag
    APB Fabric Information

    This pie chart shows you the device information based on HwSKU and the device OS. You can hover the mouse pointer over the charts to display a tooltip with more relevant information.

    Click Save to create the user.

    Tables showing users, roles, and management options
    Critical
    ,
    Alert
    , and
    Emergency
    . This is a multi-select menu where you can select multiple severity levels to be displayed.
    Table showing system log of a device
    The following image shows the APB fabric information charts:

    hashtag
    Platform Health

    The platform health table shows you the CPU usage, memory availability, and link status for each connected devices. From this data you can infer the overall health of the platform.

    The following image shows the platform health table:

    hashtag
    Link Information

    The link information table shows you the total number of ports from all the connected devices, the number of ports that are enabled with admin privileges, and the number of ports that are connected at any given moment.

    The following image shows the link information table:

    hashtag
    Top 5 Ports by Traffic

    The top 5 ports by traffic shows you the top 5 ports across all connected devices sorted on the basis of their traffic rate. The table shows you the device, port number, the number of In Ucast packets, the number of Out Ucast packets, the number of In Discards, and the number of Out Discards.

    The following image shows the top 5 ports by traffic table:

    hashtag
    Top 5 Devices by Flow

    The top 5 devices by Flow shows you the top 5 devices sorted on the basis of the number of flows they have. The table shows the device IP, the number of flows, and the number of rules.

    The following image shows the top 5 devices by flow table:

    hashtag
    Top 5 Flows by Traffic

    The top 5 flows by traffic shows you the top 5 flows across all connected devices sorted on the basis of their traffic rate. The table shows you the device IP, flow alias, and the count.

    The following image shows the top 5 flows by traffic table:

    hashtag
    Docker Statistics

    The docker statistics table shows you the docker statistics across all connected devices along with the CPU and memory usage for each device.

    The following image shows the docker statistics:

    hashtag
    Syslog Statistics

    The syslog statistics table shows you the system log statistics of all connected devices. The table shows the number of messages in the info, debug, error, notice, and warning categories for each device.

    The following image shows the syslog statistics:

    Pie chart showing the details of fabric based on HWSKU and OS
    Table showing the health information
    Table showing link information
    Table showing top 5 ports by traffic
    Table showing Top 5 devices by Flow
    Table showing Top 5 Flows by Traffic
    Table showing Docker Statistics
    Table showing syslog statistics