# Rules Type
## Rules Type
There are Three types of Rule a user can configure
1. Device Based
1. Deivice health, utilization and other related metric trend alerts
2. Interface Based
1. For all Interface related metric alerts
3. Server Based
1. For GPU trend alerts
## Filter Option
User can use 2 types of filter for the Alerts
1. Quick Filter
1. Region Based
2. Host/IP Based
3. Port Based
4. Role Based
5. Fabric Based
6. SKU Based
7. ASIC Based
8. Platform Based
9. AZ ID Based
10. Brick ID Based
11. Rack ID Based
2. Advanced Filter; Works like Regular Expression
1. Can match the inputs by
1. **Equal**
2. **Contain**
3. **Does not Contain**
4. **Does not start with**
5. **Starts With**
6. **Ends With**
7. **Is Empty**
8. **Is Not Empty**
9. **Not Equals**
#### Possible Values & Description
1. **Rule Name:** The user can choose any related name
2. **For:** The user can the type of filter
Device: Once the user chooses the rule for Devices it will show the below Metrics
* ASIC IPv4 Routes
* ASIC IPv6 Routes
* BGP Neighbours Down
* Device CPU Core Temperature
* Device CPU Utilization
* Device Down
* Device Memory Utilization
* Device Queue Transmit Counter
* FAN Speed
* Failed FANs
* Failed PSUs
* PSU Temperature
* SSD Health
* SSD Temeperature
* SSD Used Memory Percent
* frr CPU Utilization
* syncd CPU Utilization
Interface: Once the user chooses the rule for Interfaces it will show the below Metrics
* Interface flap
* Interface PFC Receive Counters
* Interface PFC Transmit Counters
* Interface Queue Transmit Counters
* Traffic InDiscards
* Traffic InErrors
* Traffic OutDiscards
* Traffic OutErrors
* Traffic Rx Utilization
* Traffic Tx Utilization
* Transceiver Rx Power
* Transceiver Temperature
* Transceiver Tx Power
* Transceiver Voltage
Server: The user will be able to get alerts for IntelGaudy
* CPU Core Temperature
* CPU Utilization
* Device Down
* FAN Speed
* GPU Memory Utilization
* GPU PSU 1 Power Draw
* GPU PSU 2 Power Draw
* GPU Temperature
* GPU Utilization
* Memory Utilization
3. **Metrics**: Metrics depend on the above **(For: Device/Interface)** condition
4. **Measure**: Metrics are measured in three diff ways
1. **MIN**
2. **AVG**
3. **MAX**
5. **Period**: Measured metrics can be verified with a buffer of a timer
1. 5 min
2. 10 min
3. 15 min
4. 30 min
5. 1 hour
#### Conditions
1. When Measured Value is: This option allows a user to choose what condition has to match when the measured value is
1. **EQ:** Equal to
2. **NEQ:** Not Equal to
3. **GE:** Greater than Equal to
4. **LE:** Less than Equal to
5. **GT:** Greater than
6. **LT:** Less than
2. **Critical Threshold:** The user can set a Critical value on which push notification will be triggered
3. **Warning Threshold:** The user can set a Warning value on which push notification will be triggered
#### Notification
1. **Notify:** The user can choose the integrated **SLACK Channel**
2. **Create Ticker: Zendesk** Users can choose this to raise the Zendesk support ticket
3. **Create Ticker: ServiceNow** Users can choose this to raise the ServiceNow support ticket
4. **Weekly Digest: Slack** Users can choose this for Weekly Digest to SLACK Channel
5. **Do not notify** if the same alert trigger in: **30min, 1hour, 2hours, 10hours, 24hours**
6. **Stop notifying after: The** user can choose a value of occurrence then it will not trigger the same in the next 24 hours
#### Troubleshooting Steps
User will have the option to add the troubleshooting steps related to rule.
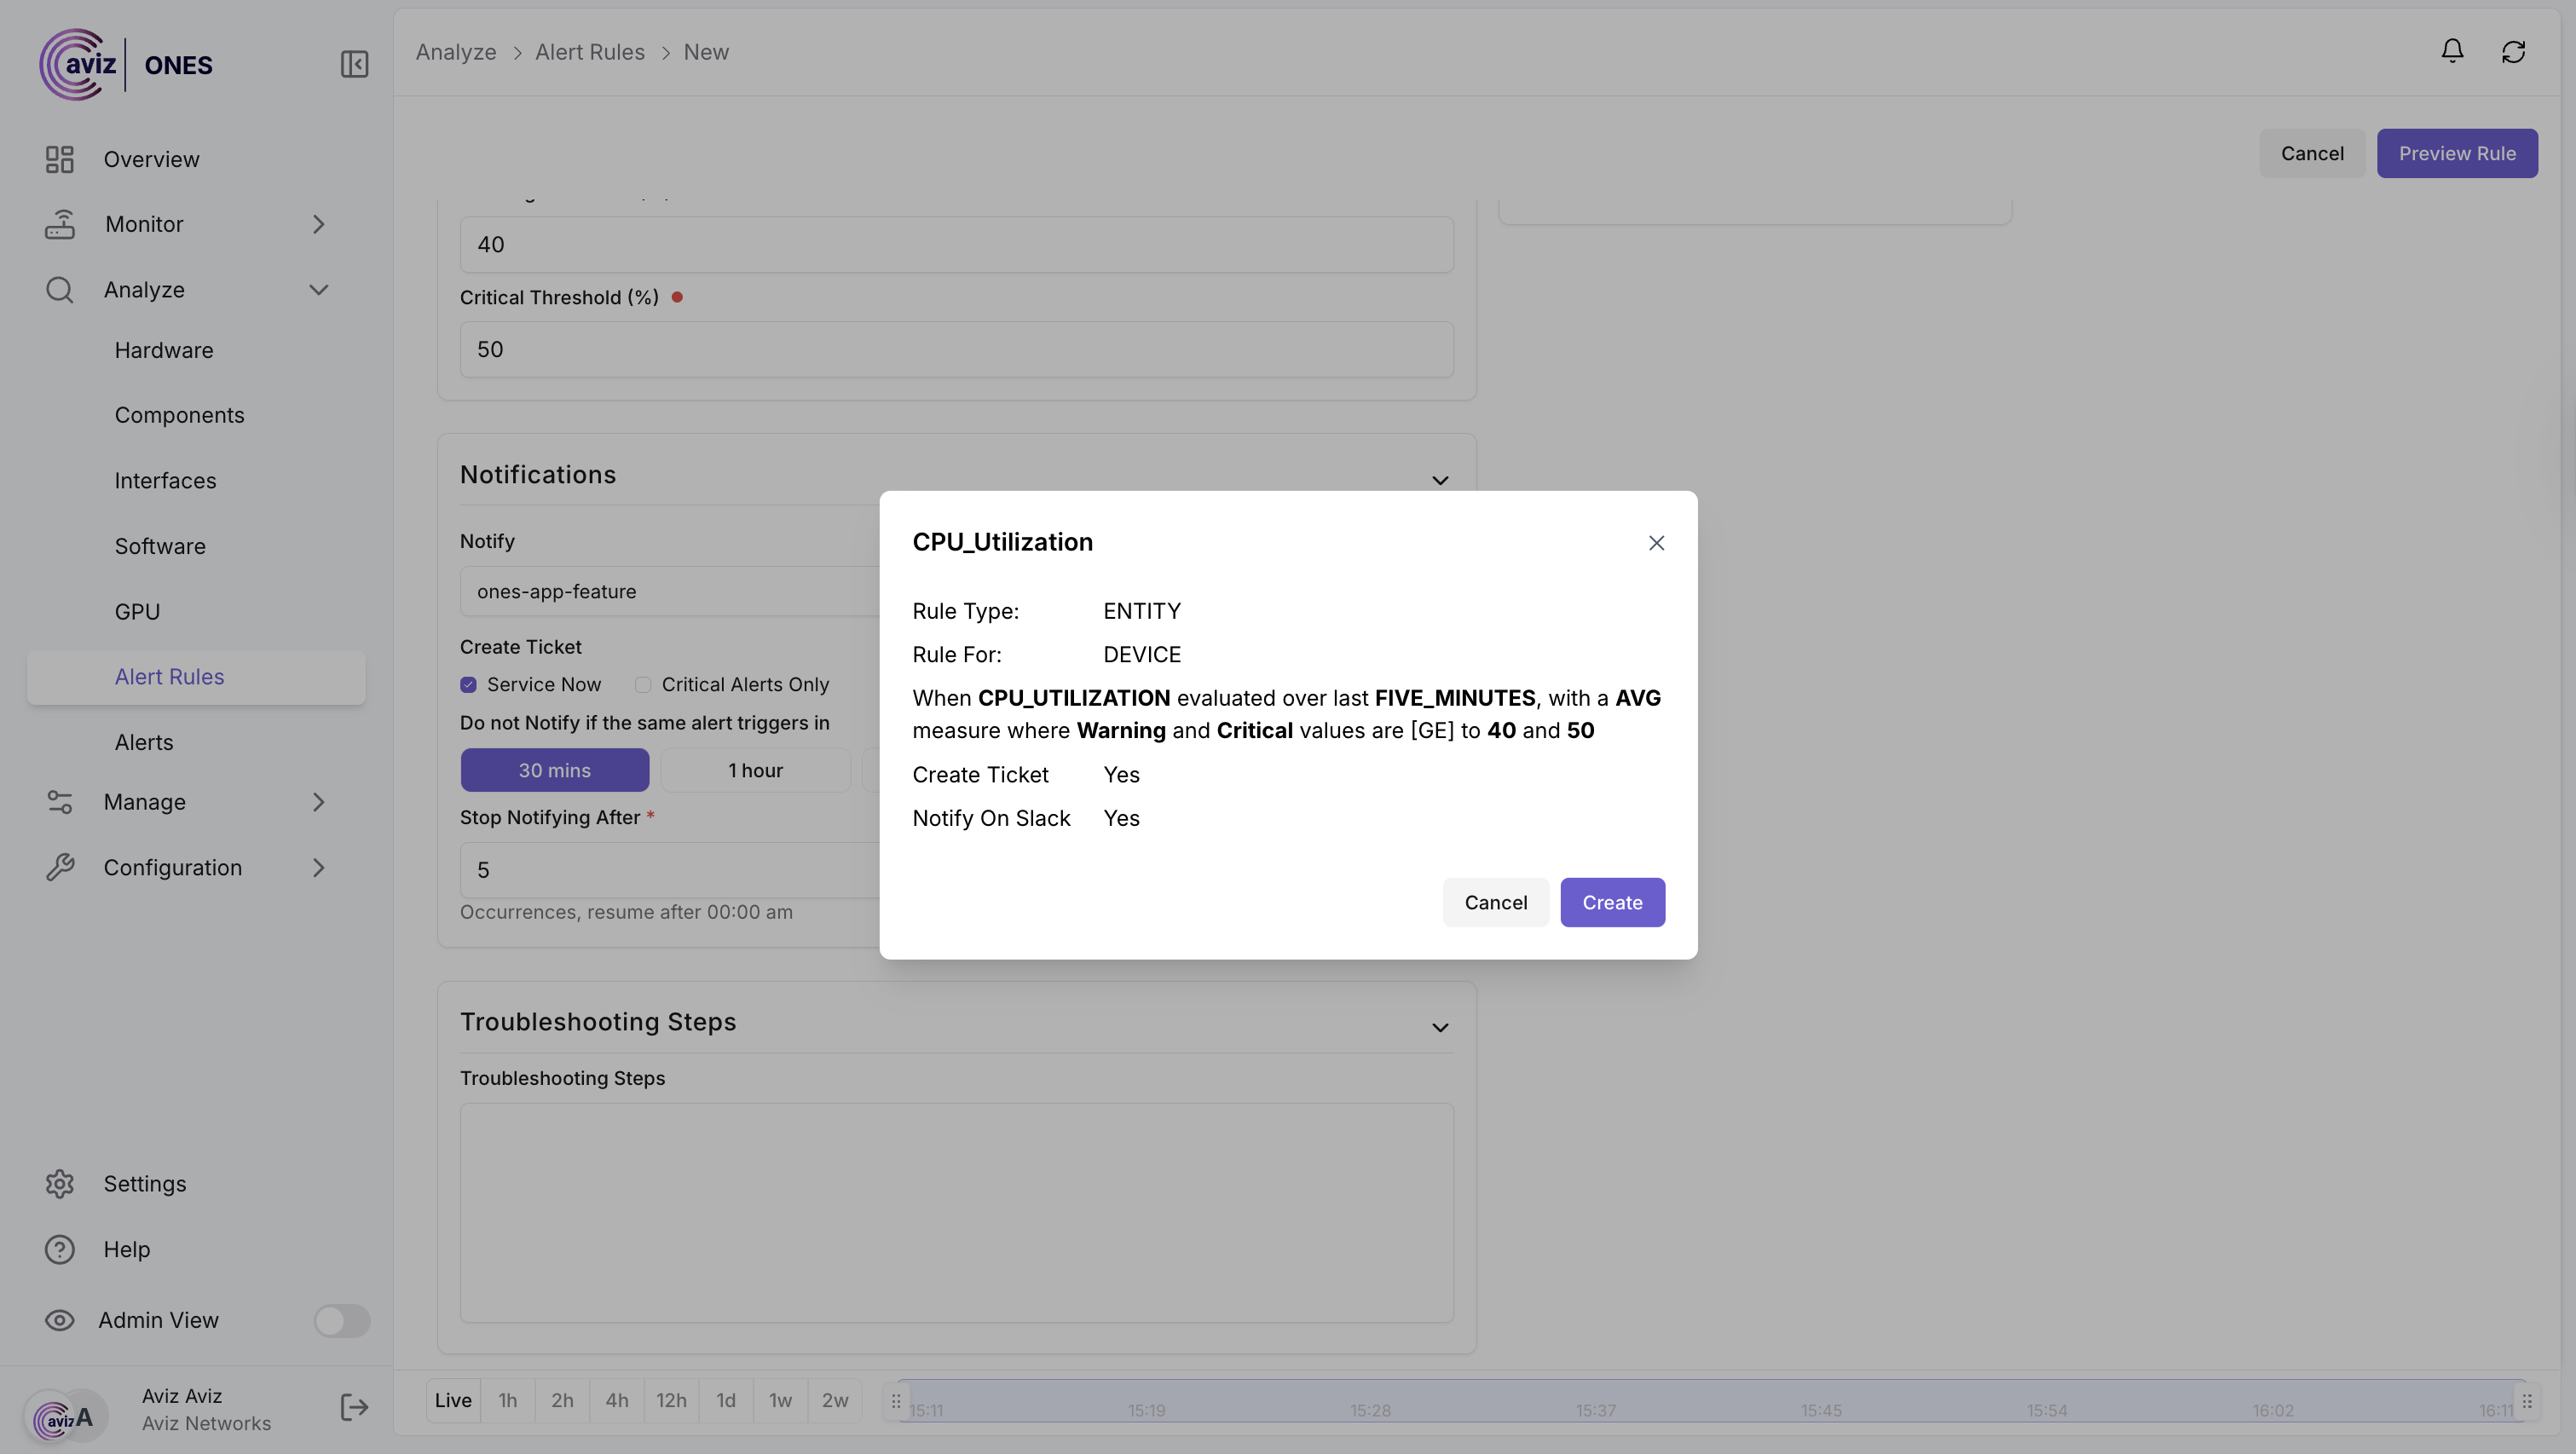
## Add Rules
**Navigation >> Analyze >> Alert Rules >> Create New**
**Add the inputs:**
**Click: Preview Rules and Create**
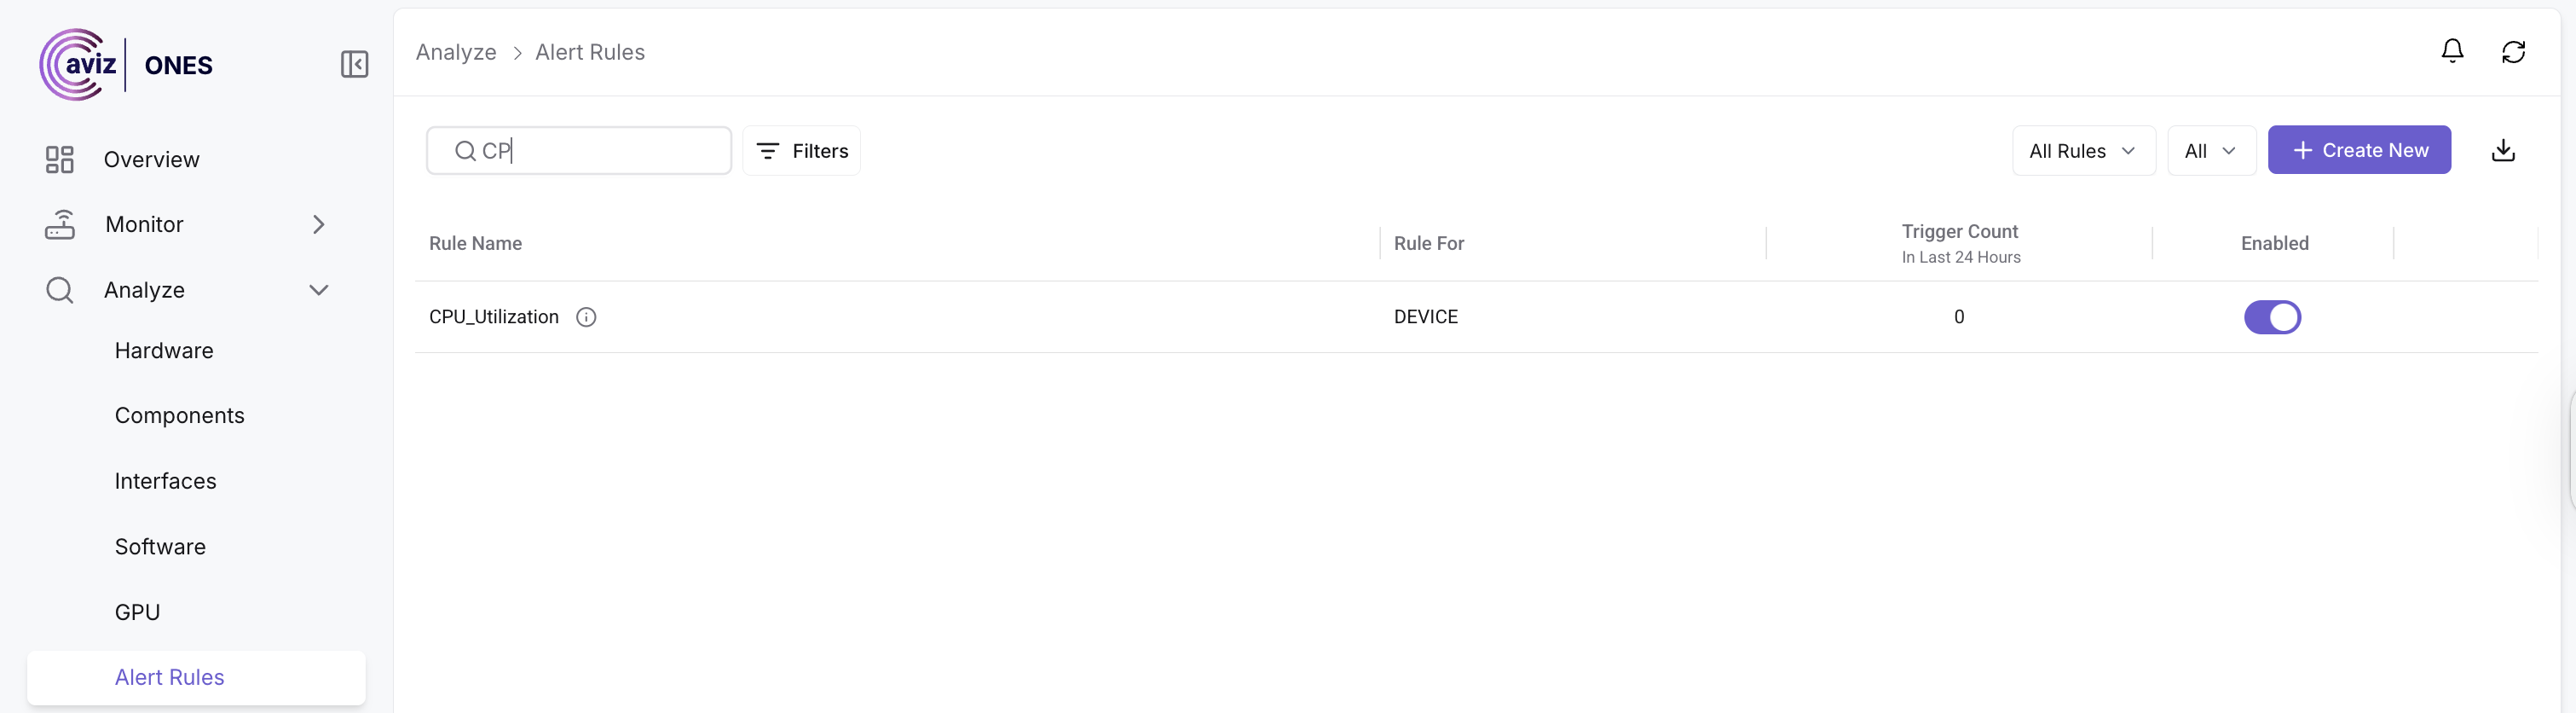
\
**Once a user create the rule it will be available in the rule list**
Once the device **CPU Utilization** goes above the threshold value it will start pushing notifications to **SLACK & ServiceNow/Zendesk** Support tickets & also inside the **ONES Alert Page**