# Monitor
## Overview
The monitor widget in ONES:
* Shows the complete topology view of the fabric
* The Topology view can be filtered by:
* Region
* Brick
* This page shows all the links and information connected to each other
* Low and high utilization of all components
* Input / Output errors on links
* ASIC detailed view of all managed devices
* BGP status
* Neighbour Count
* Neighbor status (Up/Down)
* Prefixes (Total/Advertised)
* ASN
* Traffic View
* input/output packets in million per sec
* Errors and Discard packets per interface
**NOTE**: If all the managed devices have the same Region/Brick ID, we do not get any filter ribbon
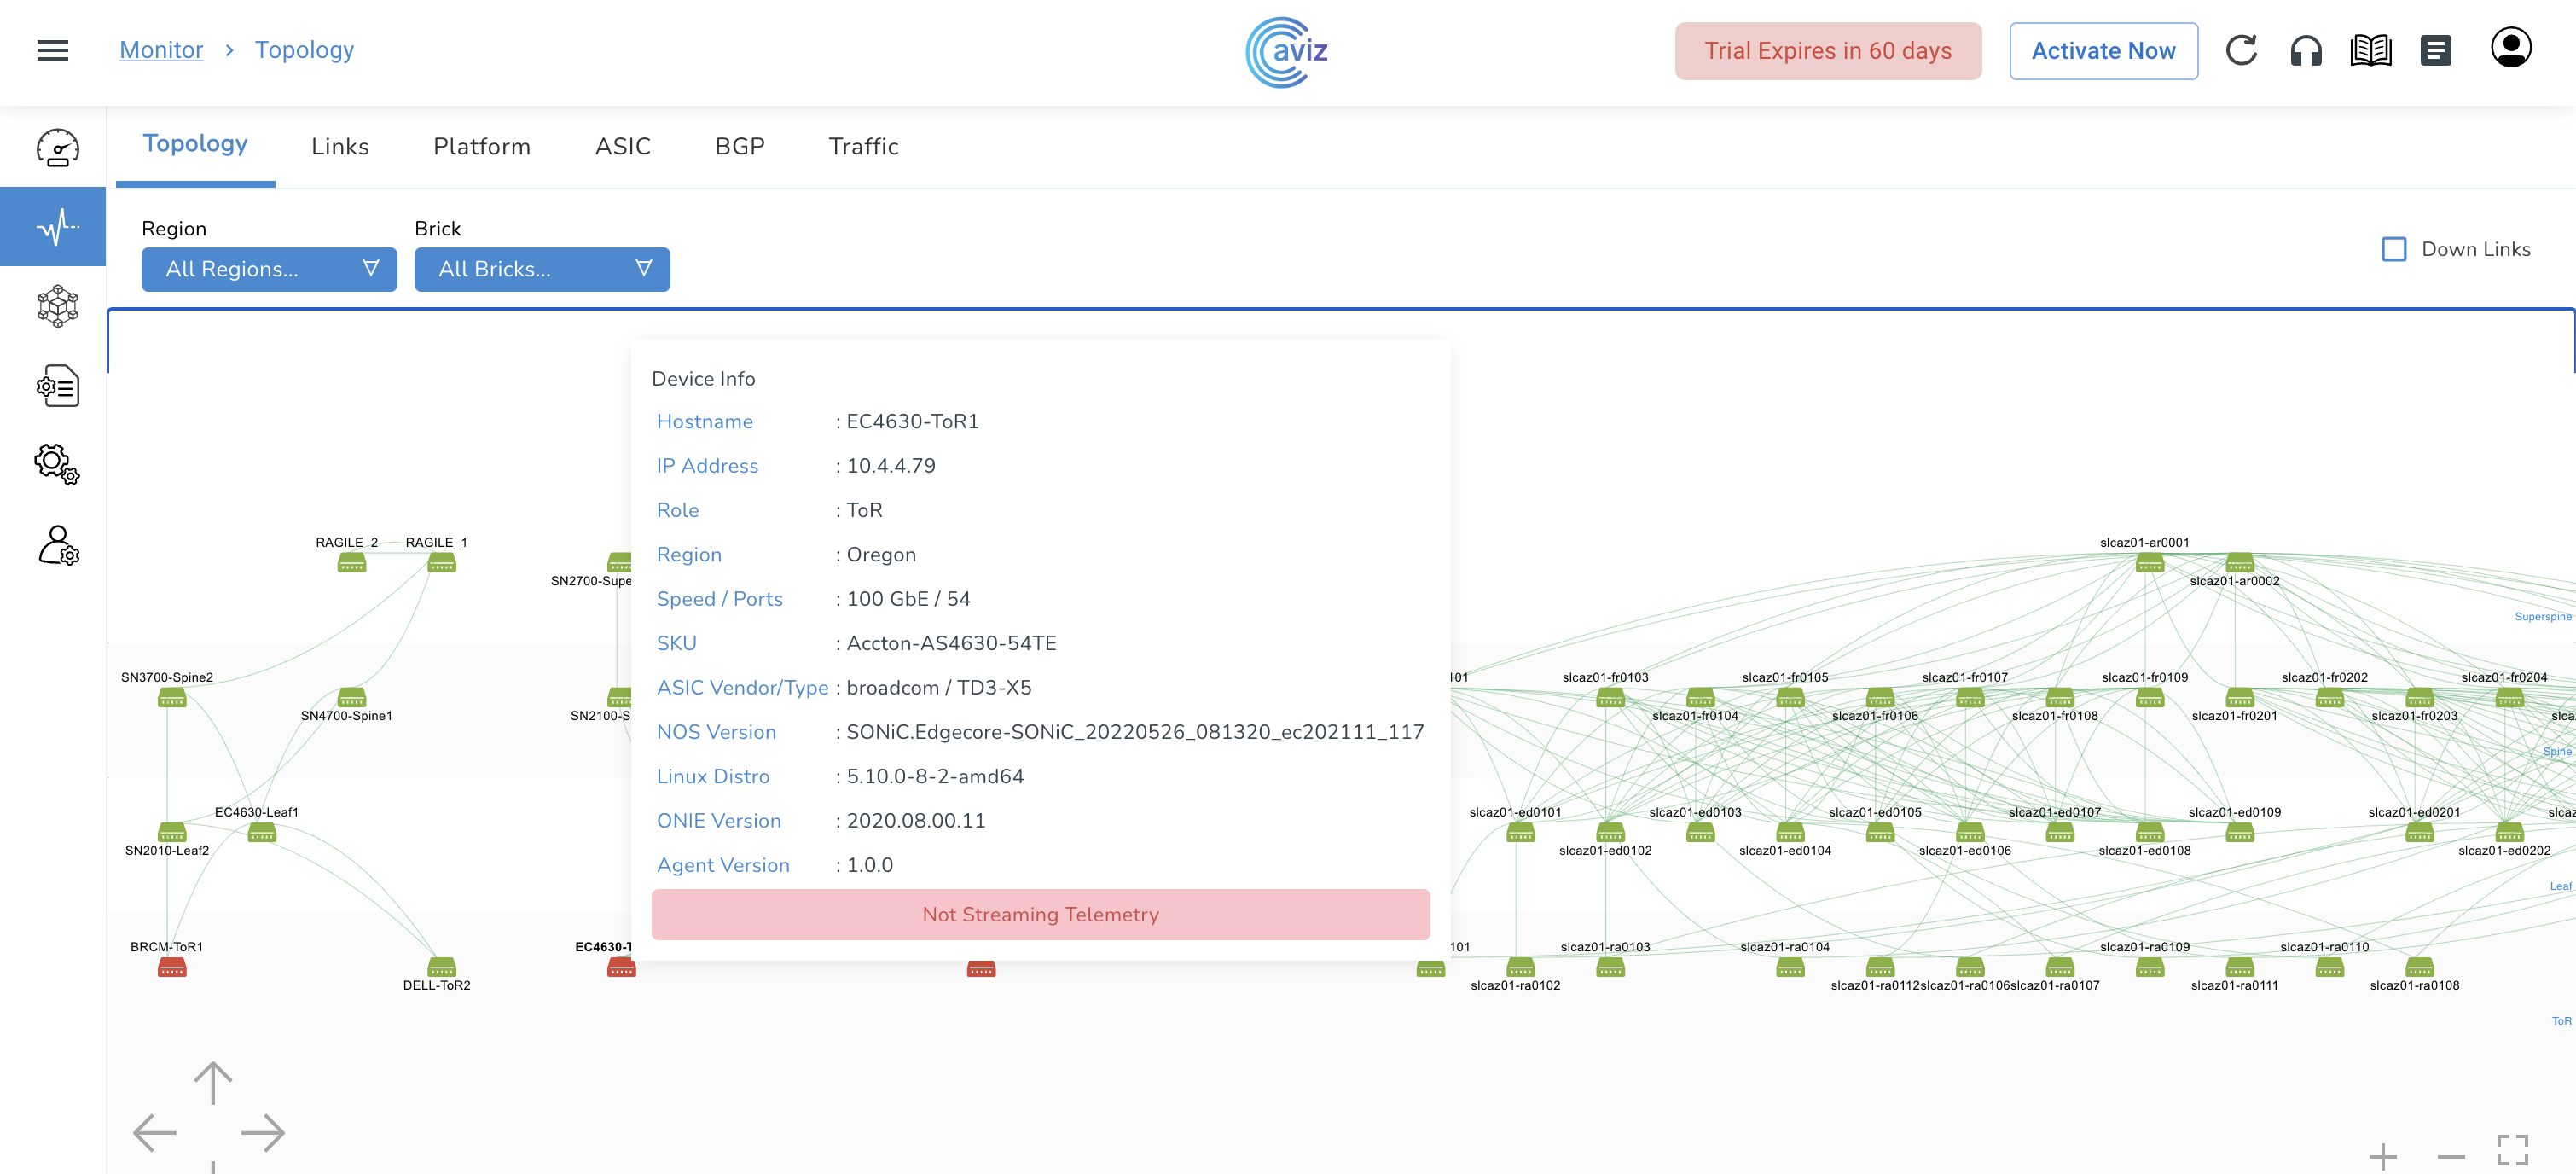
## Topology
* Navigate to **Monitor >> Topology**
* This shows the complete Topology view, how the devices are connected and to which role they belong to
* We can put the filters to check the customized view of the Diagram by: Region Availability Zone Brick ID
**NOTE**: we do not get filter ribbon if all devices belong to the same Region/Availability Zone/Brick ID
* We can also check Down Links to check the topology those are having links in the shutdown state as per Role
* Super Spine
* Spine
* Leaf
* ToR
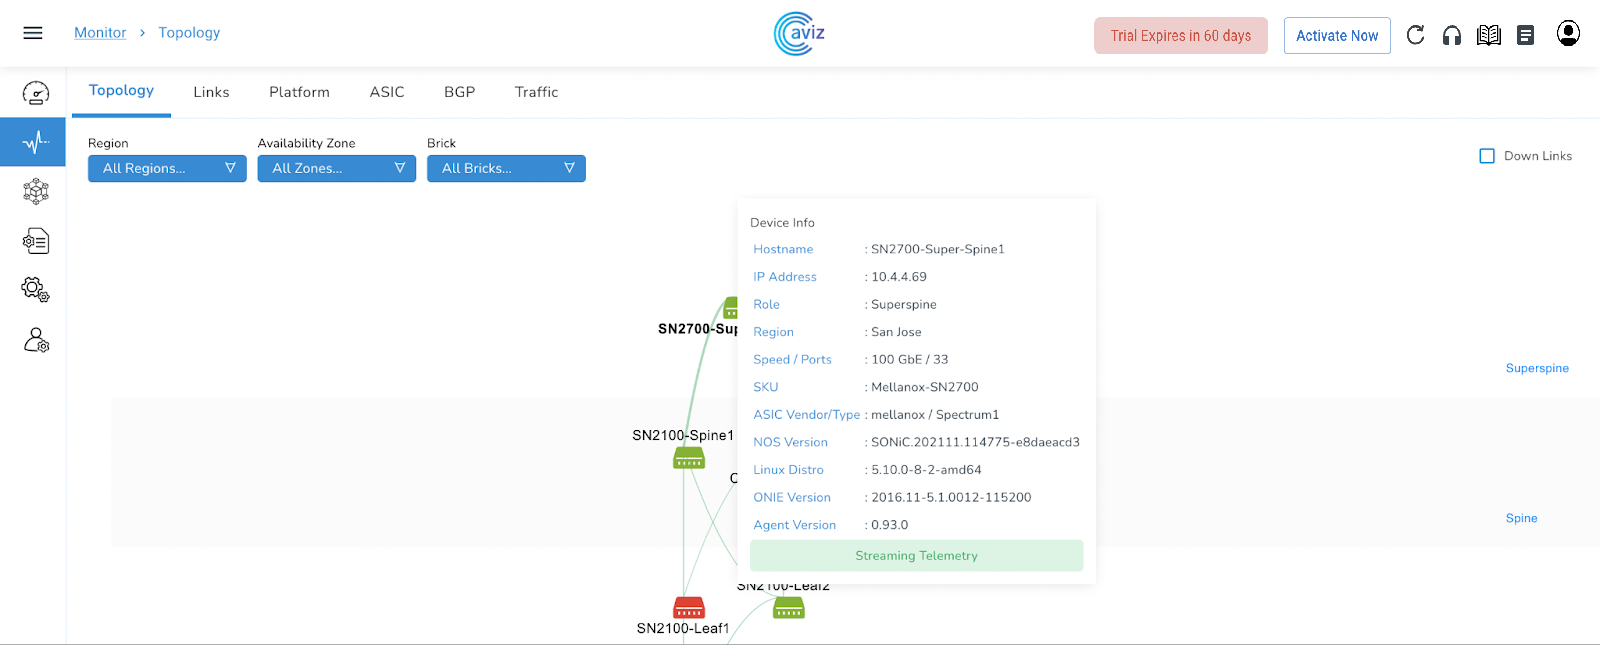
* When we hover the cursor over any device, we get the device status and device details popup
* Users can easily filter the view as per the Region, Availability zone and Brick ID
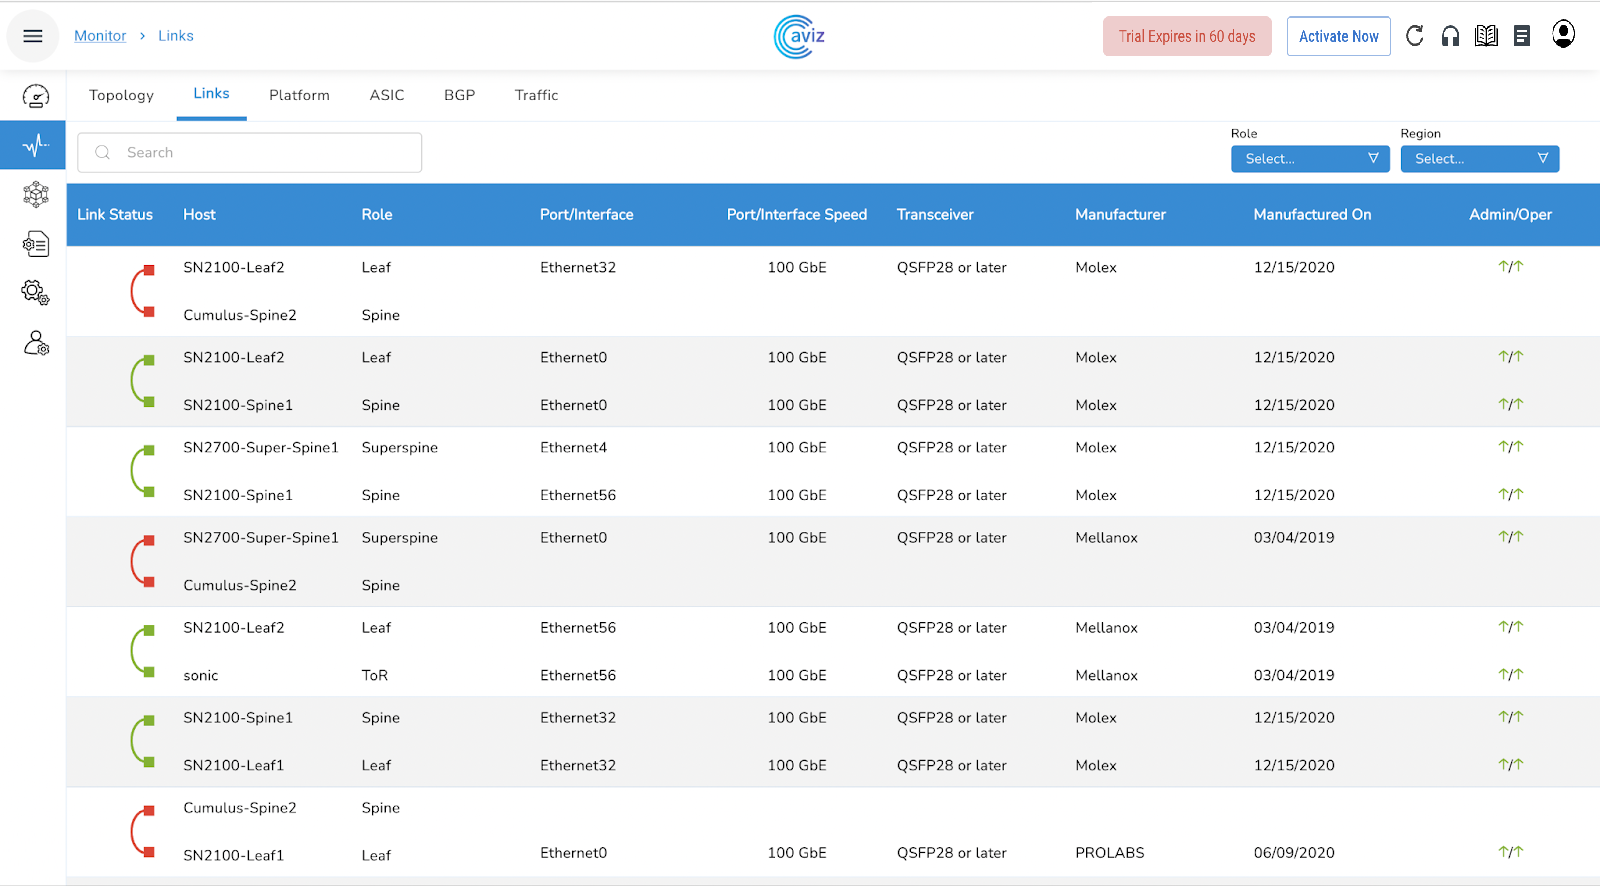
## Links
This page gives a view to the user for all the possible connected links between devices with a few more capabilities
* Navigate to **Monitor >> Links**
| Feature | Use |
| ------------------------- | ------------------------------- |
| Hostname | Hostname of the managed device |
| Role | Role of the device |
| Port/Interface | Interface details |
| Port Speed | Link speed of connected devices |
| Transceiver | SFP/QSFP Optics statuts |
| Manufacturer | Device Manufacturer |
| Manufactured Date | Date of Manufacturing |
| Admin and Operator status | Local and Remote status of link |
* This page helps a user to get the best view of the number of connections between devices with speed and other manufacturer details
* This page gives the exact view of the interface name, interface speed, transceivers and admin & operator status
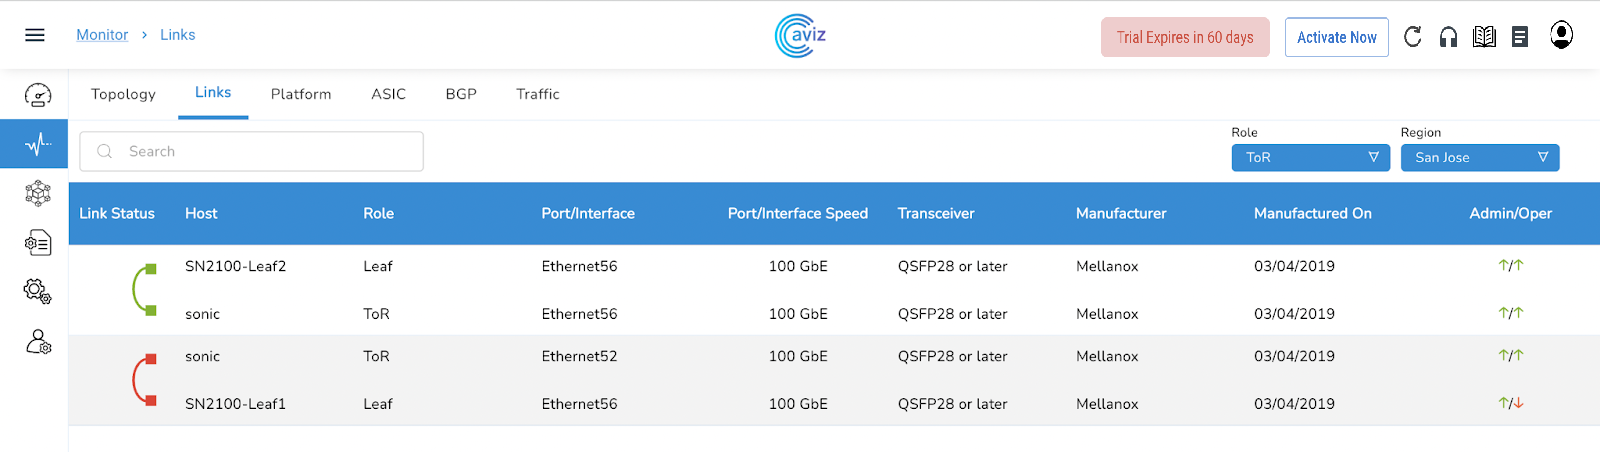
### Links View with Filter Ribbon
* We can also have a filtered view of links
* Choose a specific Role and Region to filter
* let's choose:
* Role: ToR
* Region: San Jose
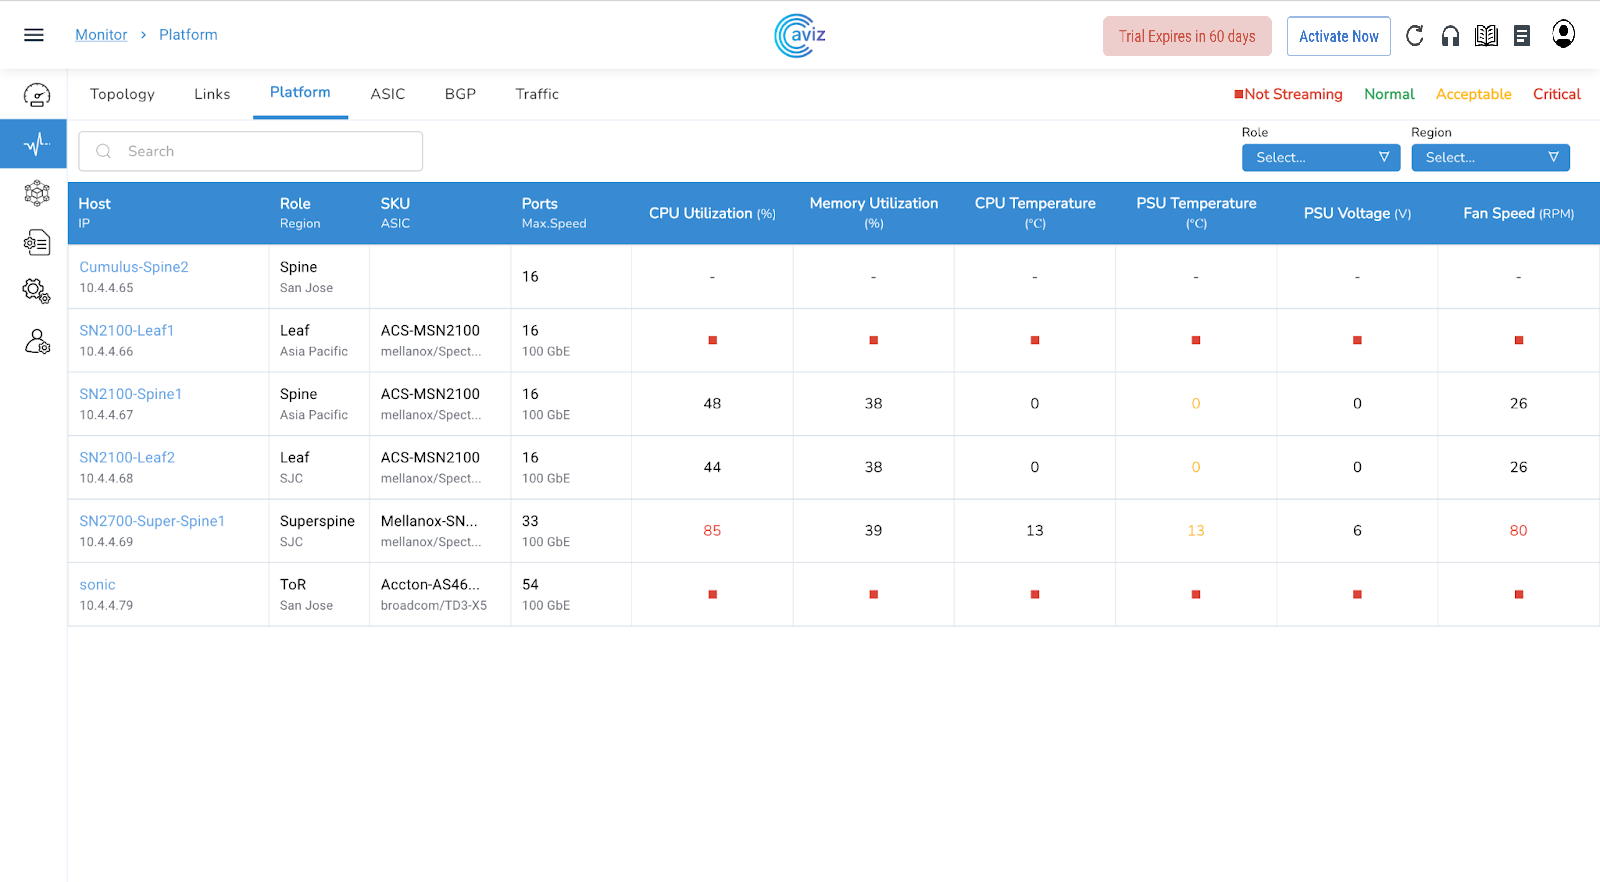
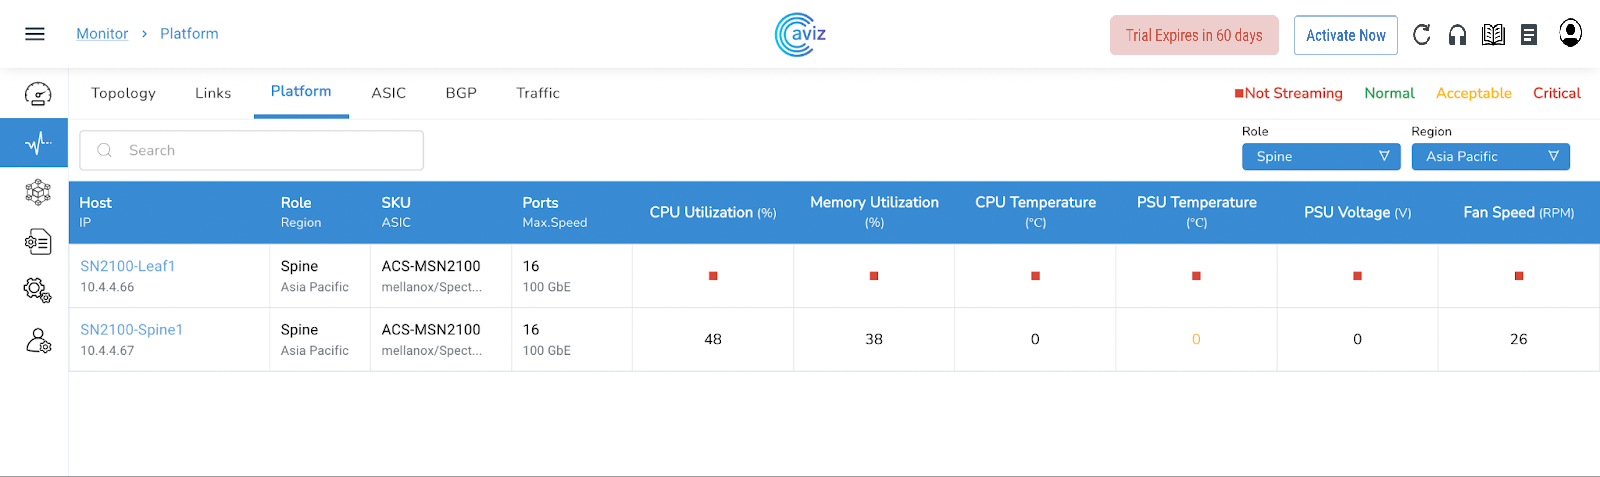
## Platform
This page shows the latest utilization of the devices with CPU & Memory utilization, Temperature & Voltage of PSU, and fan speed in RPM
* Navigate to **Monitor >> Platform**
### Platform Status
Platform Status is reported for the following components
* Roles
* SKU/ASIC
* Ports/Max Speed
* CPU Utilization (%)
* Memory Utilization (%)
* CPU Temperature (℃)
* PSU Temperature (℃)
* PSU Voltage (V)
* Fan Speed (RPM)
Feature
Uses
HOST / IP
Device Name
Device IP
Roles/Region
Device Role
Device Region
SKU/ASIC
SKU (Stock Keeping Unit)
ASIC
Port/Max Speed
Total number of ports available
Speed of ports
CPU Utilization (%)
CPU Utilization reported in 4 states
Normal
Acceptable
Critical - Action needed
Not Streaming - Agent is not up
Click on any device to get the view/status of all the components related to that device
Memory Utilization (%)
Memory Utilization reported in 4 states
Normal
Acceptable
Critical - Action needed
Not Streaming - Agent is not up
Click on any device to get the view/status of all the components related to that device
Average CPU Temperature (C)
Details of the temperature of the CPU across all the devices in degrees celsius
Any device that breaches the configured acceptable or critical value will be shown here
Click on any device to get the view/status of all the components related to that device
Average PSU Temperature (C)
Power Supply Temperature in degrees celsius
Any device that breaches the configured acceptable or critical value will be shown here
Click on any device to get the view/status of all the components related to that device
PSU (Voltage)
Power Supply Voltage readings in volts
Any device that breaches the configured acceptable or critical value will be shown here
Click on any device to get the view/status of all the components related to that device
Average Fan Speed (%)
Fan Speed in % of maximum supported RPM
Any device that breaches the configured acceptable or critical value will be shown here
Click on any device to get the view/status of all the components related to that device
### Customized View
* We can check the health of the device as per some customization
* We can filter the devices by:
* Roles
* Region
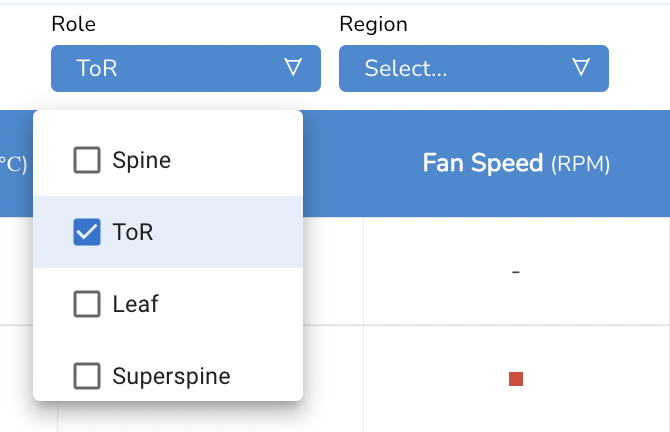
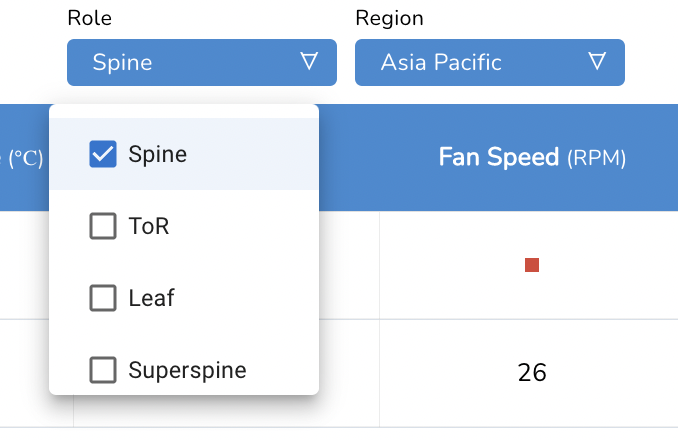
#### Role-based Customization
* We can choose a role using the available Role-based option
* 4 Roles available
* Super Spine
* Spine
* Leaf
* ToR
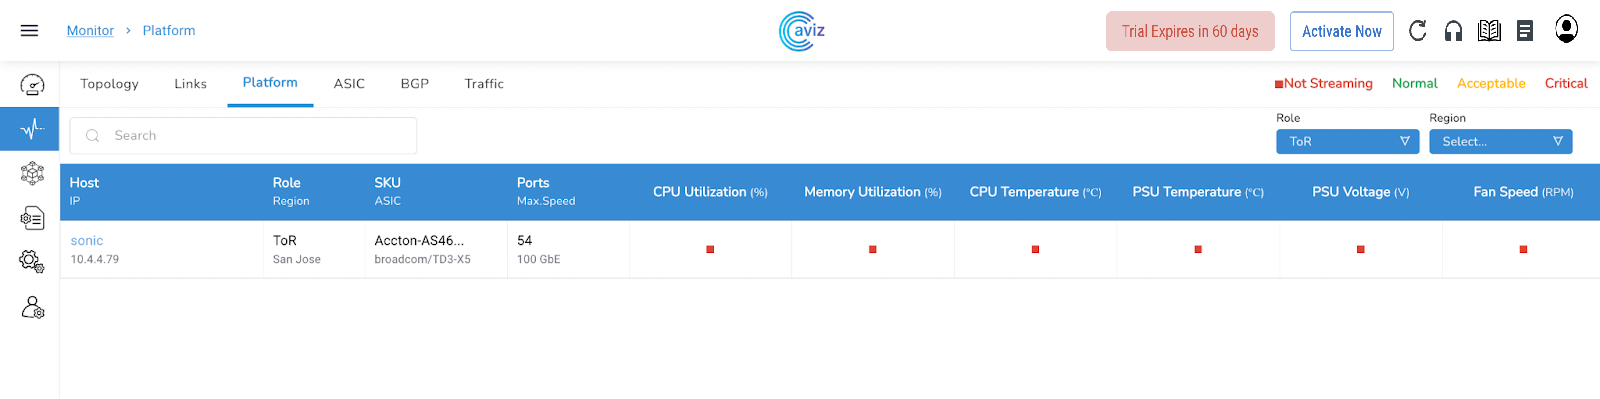
* Let’s check it with a ToR filter
* After selecting ToR input, here is the new view of only devices that belong to the ToR Role
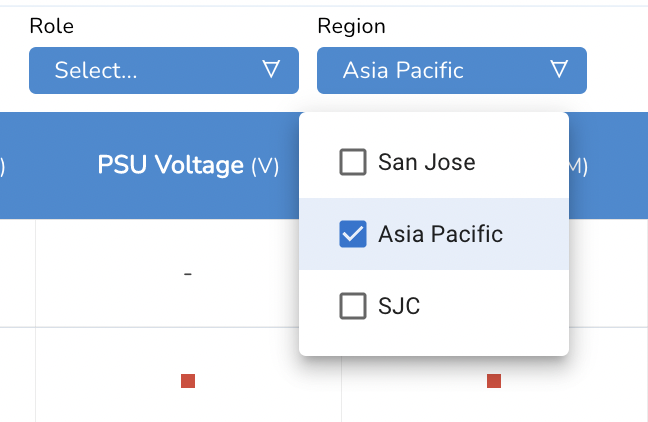
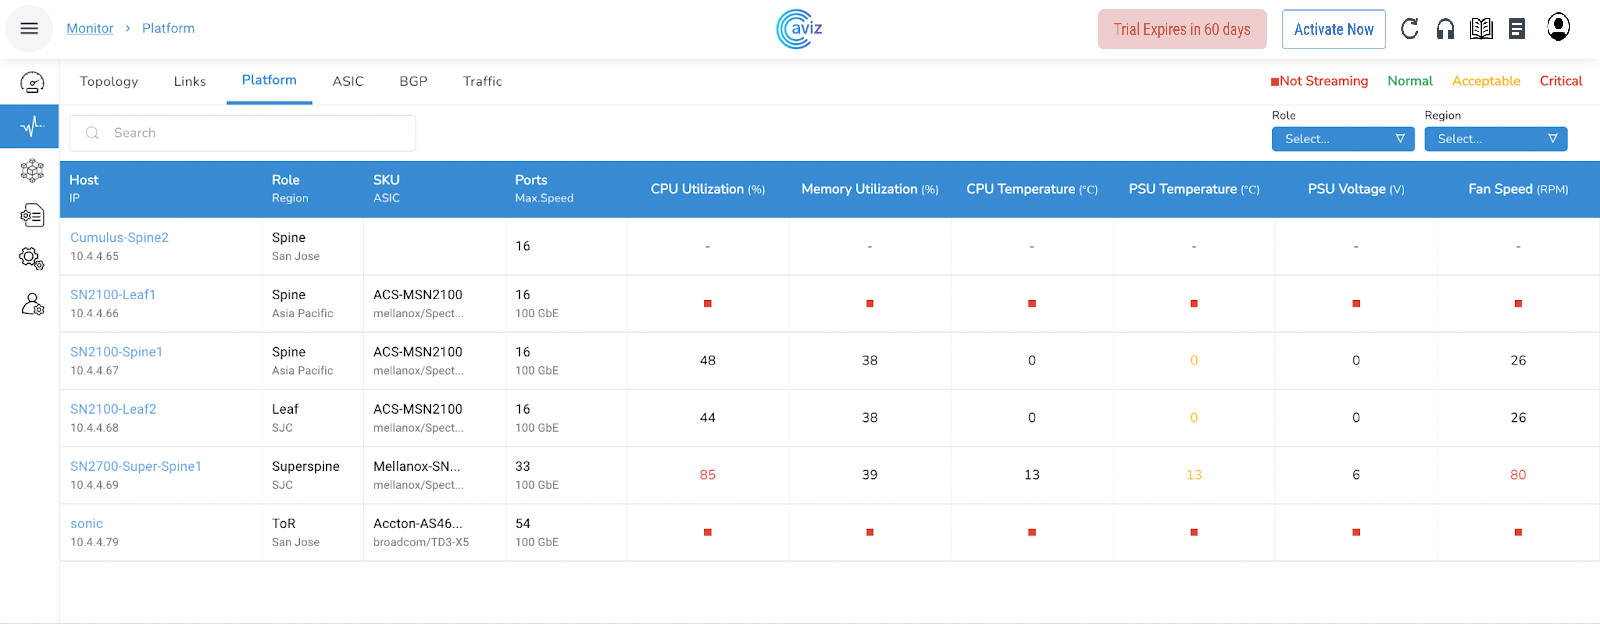
#### Region-based Customization
* We can choose a role using the available Region-based option
* Two roles available
* San Jose
* Asia Pacific
* Let’s check it with Asia Pacific Region
* After selecting Asia Pacific input, here is the new view of only devices that belongs to the Asia Pacific Region
#### Role / Region based Customization
* We have the liberty to do the filtering by both combination Role-based and Region based at the same time
* As of now, we have two Region available
* San Jose
* Asia Pacific
* 3 Roles available
* Super Spine
* Spine
* Leaf
* ToR
* Let’s check it with a combination of Asia Pacific & Spine Role
* After selecting both Roles and Region-based filter, here is the new view of the device that belongs to the Spine role and parallel belongs to Asia Pacific Region
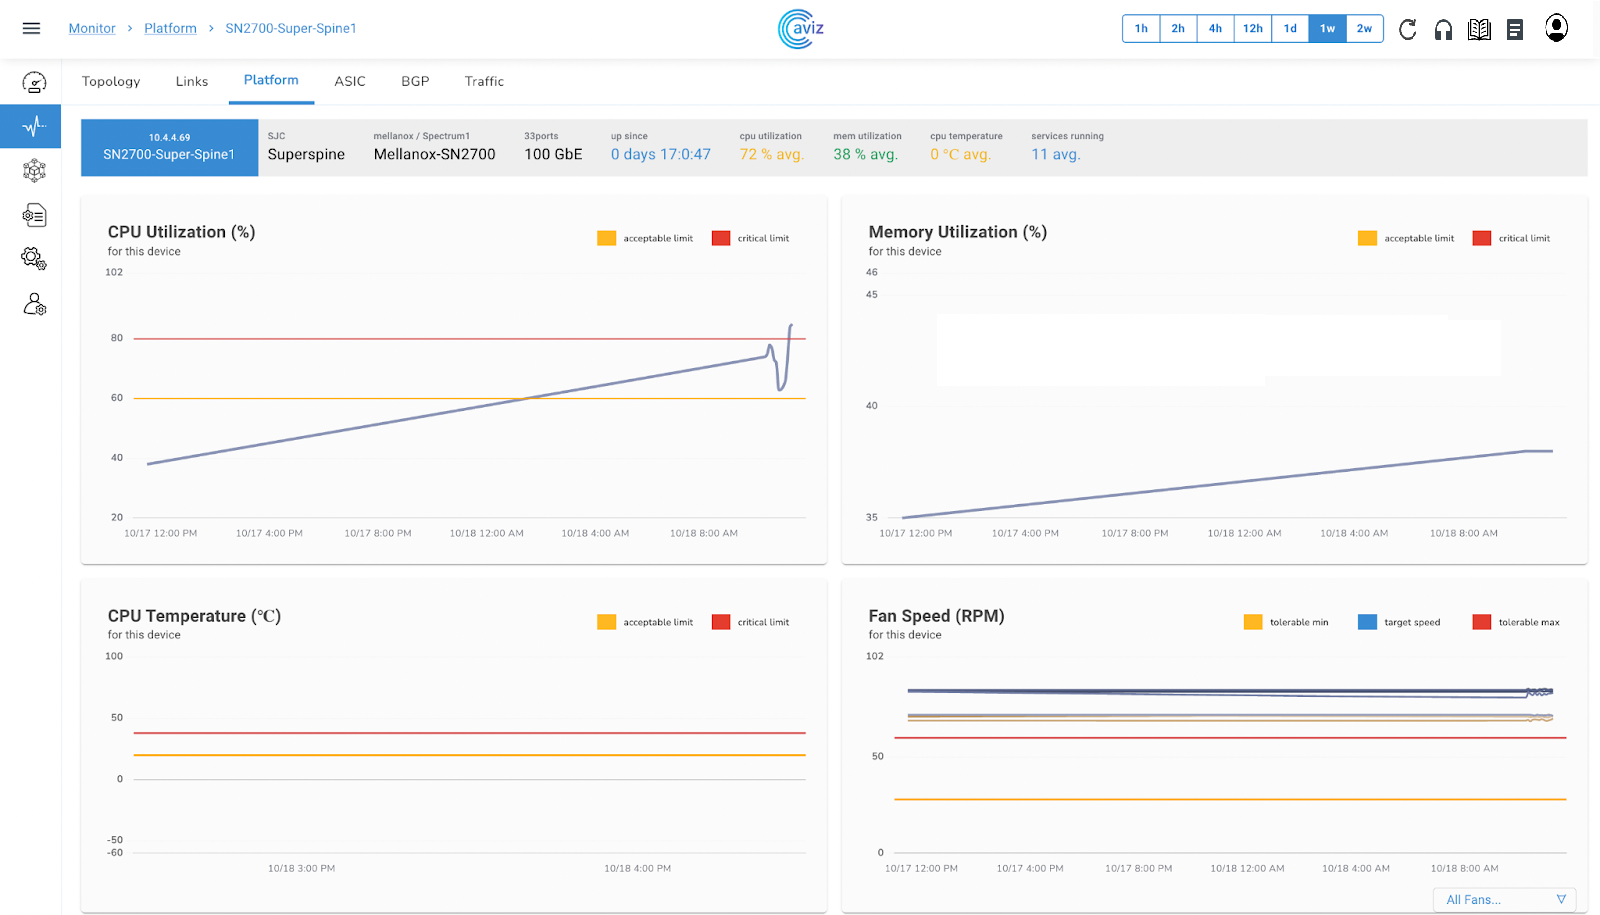
### Per Device Status
* This Platform Widget also gives the option to check the extended capability view of the device
* Apart from this monitoring view, we can also verify/check extended feature sets like:
* PSU Current (A)
* PSU Power (W)
* Services Running
* Services CPU/Memory Consumption (%)
* To view per device status including these new widgets, click on any of the device statuses present on the Platform tab
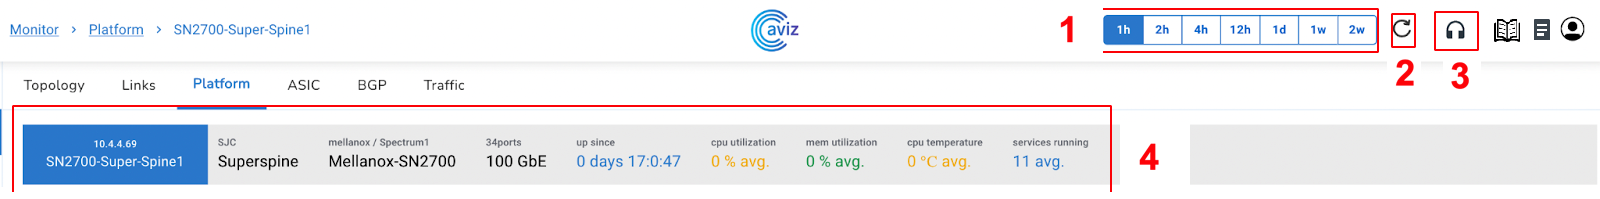
* When we choose a specific device we get an output like this
#### Device Info Ribbon
Feature
Use
1
Time Frame: Check Utilization Trends based on Time Range The application has the capacity to store up to 2 weeks of data
2
Refresh Component Status
3
Raise a Ticket for Technical Support
4
Device Details
Platform
Number of Ports and Speed
Agent Version
Uptime
CPU Utilization
Memory Utilization
CPU Temperature
Services running on the device
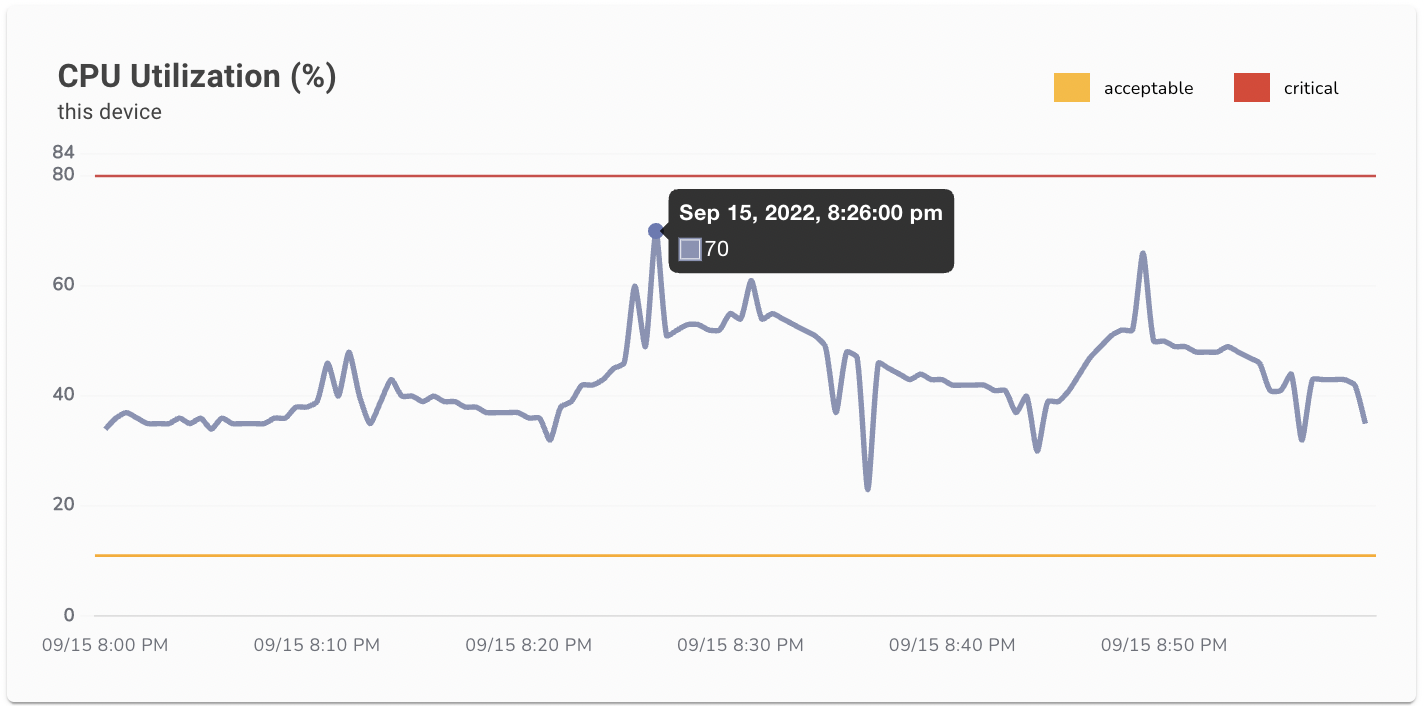
#### CPU Utilization (%)
* Here we get the complete status of CPU utilization with a time range A complete status What was the utilization from starting to end
* To check a specific time detail we can hover the cursor to any level
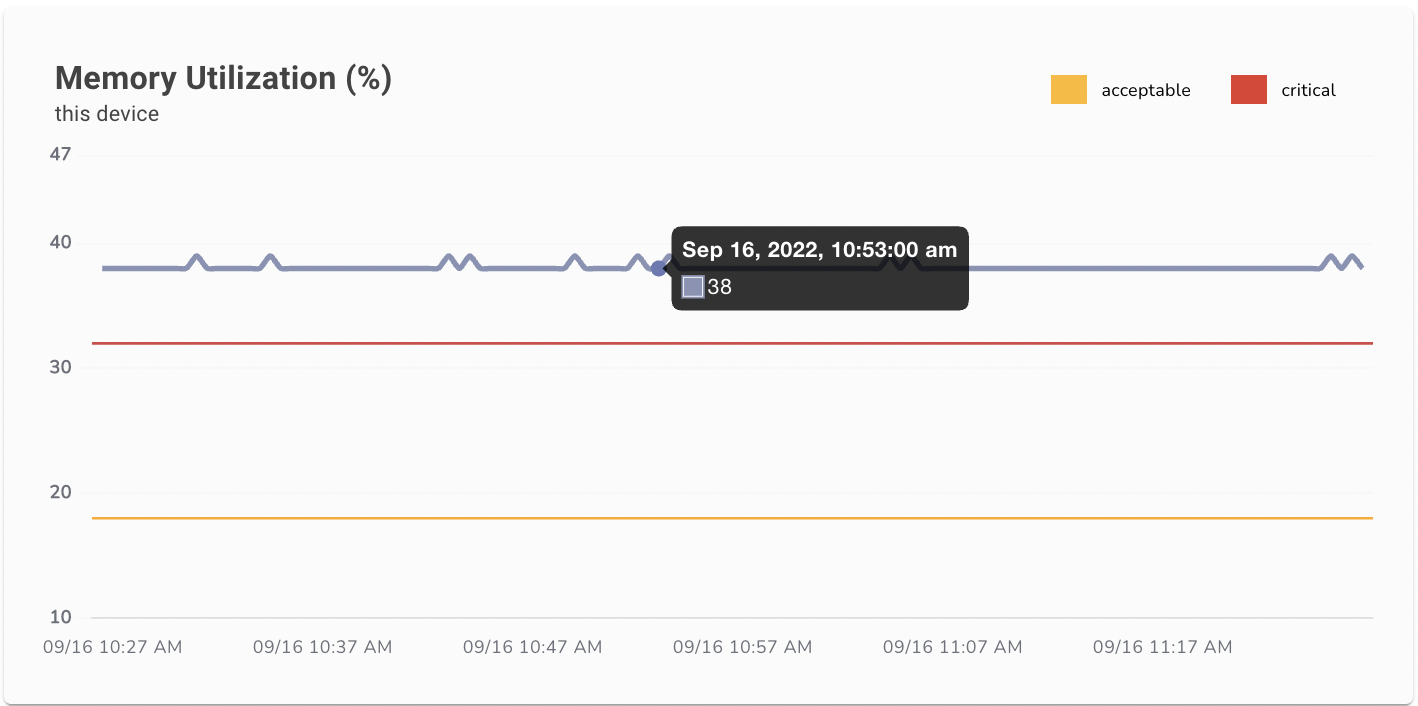
#### Memory Utilization (%)
* Now here we get the status of memory utilization of selected device
* To check a specific time detail with memory utilization, we can hover the cursor to any level
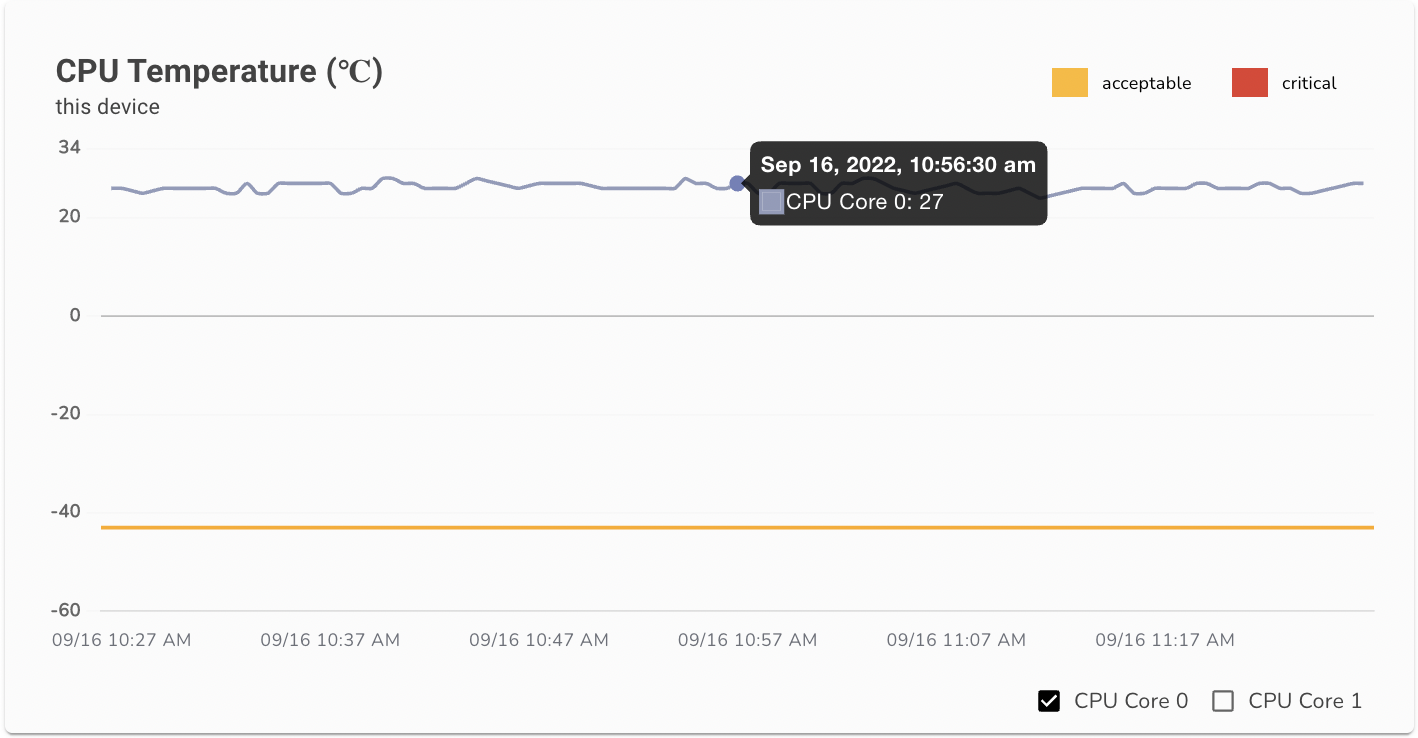
#### CPU Temperature (C)
* This template shows the status of CPU temperature in degree celsius
* Here we get the status of all the CPU and Core running on the device
* To check a specific time detail for all the CPU/Cores, we can hover the cursor on any level
* We can also check Per CPU Core details
* We can see here the customized view per CPU Core
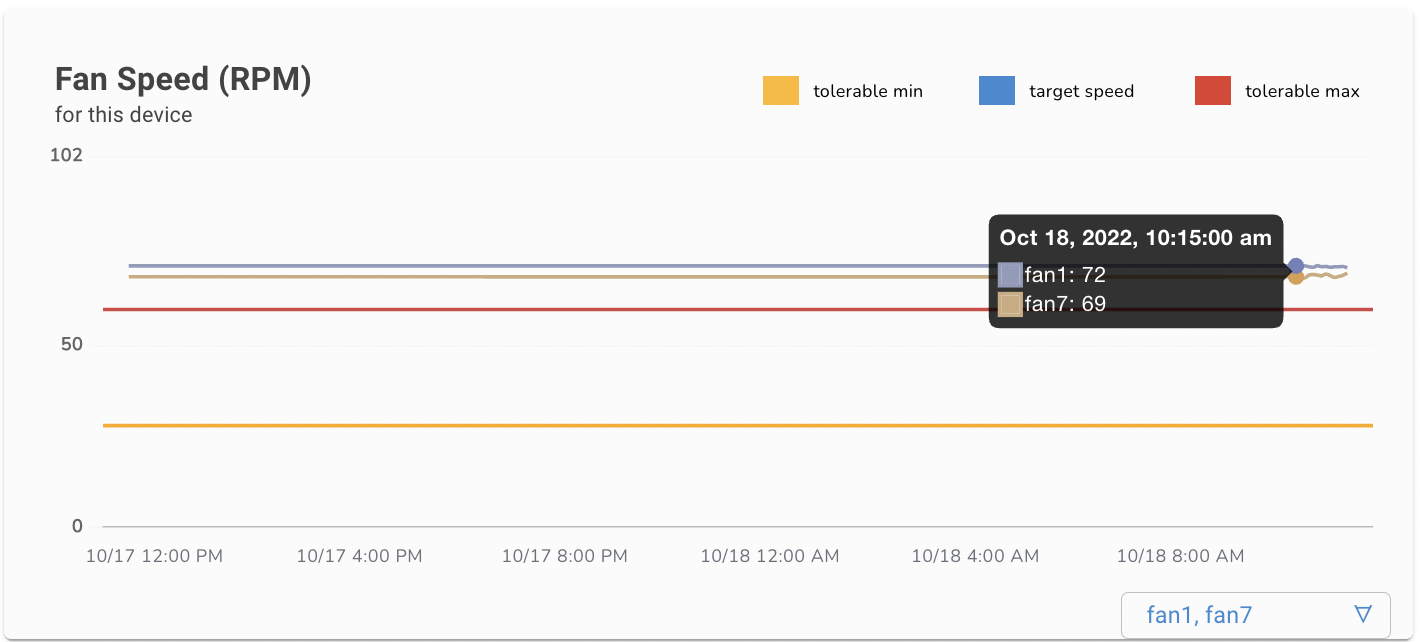
#### Fan Speed (%)
* Here we get the status of the FAN speed percentage level across all fans available on the device
* To check a specific time detail we can hover the cursor on any level
* We can choose to view the customized view of a few fans at once
* Here we can see the output of fan1 and fan7 in this customized view
* When we move the cursor to check the exact status of fans at a particular time
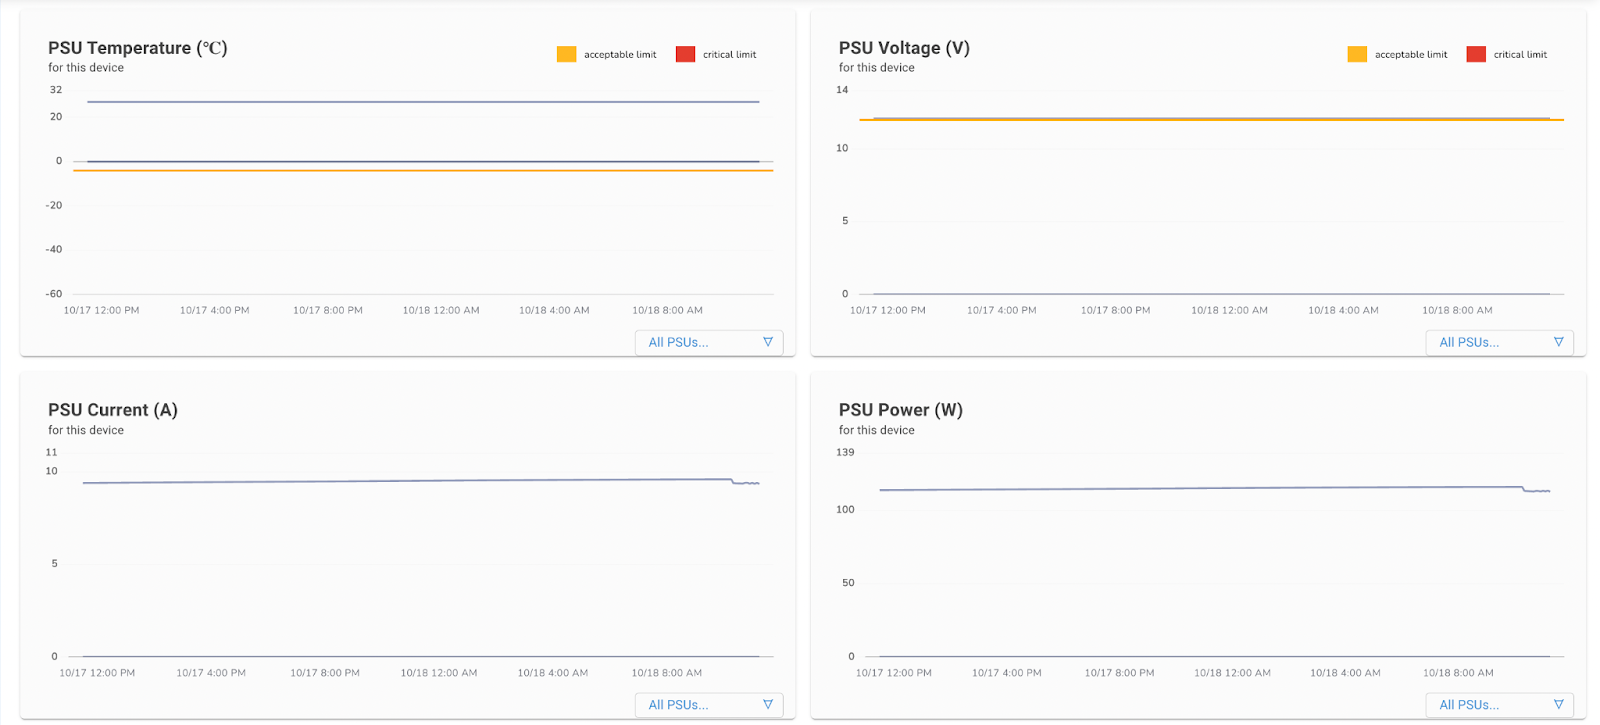
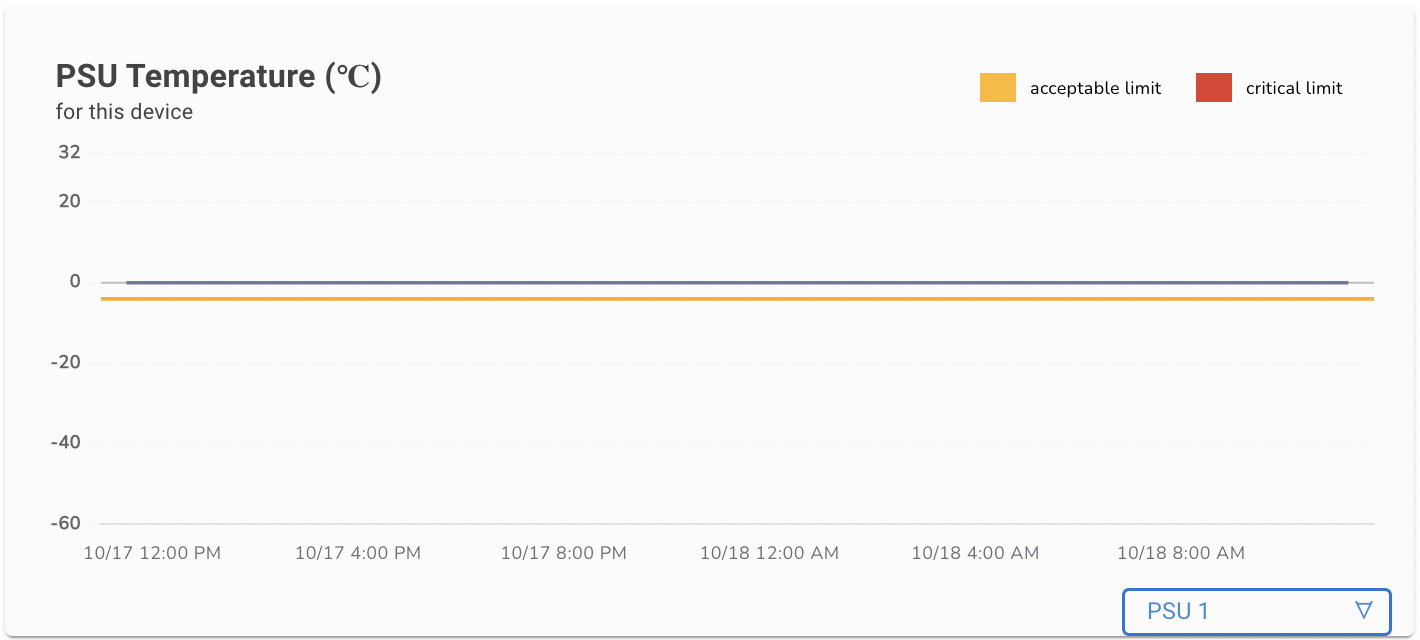
#### PSU Temperature (C)
* This widget provides the status of the Power Supply Unit (PSU) temperature (in degree celsius) across all power supplies available on a particular device.
* To check a specific time detail we can hover the cursor on any level
* We can choose to view the customized view of a few PSUs at once
* In our case, we have 2 PSUs, so now let's choose one of them and check the output
* When we move the cursor to check the exact status of the PSU at a particular time
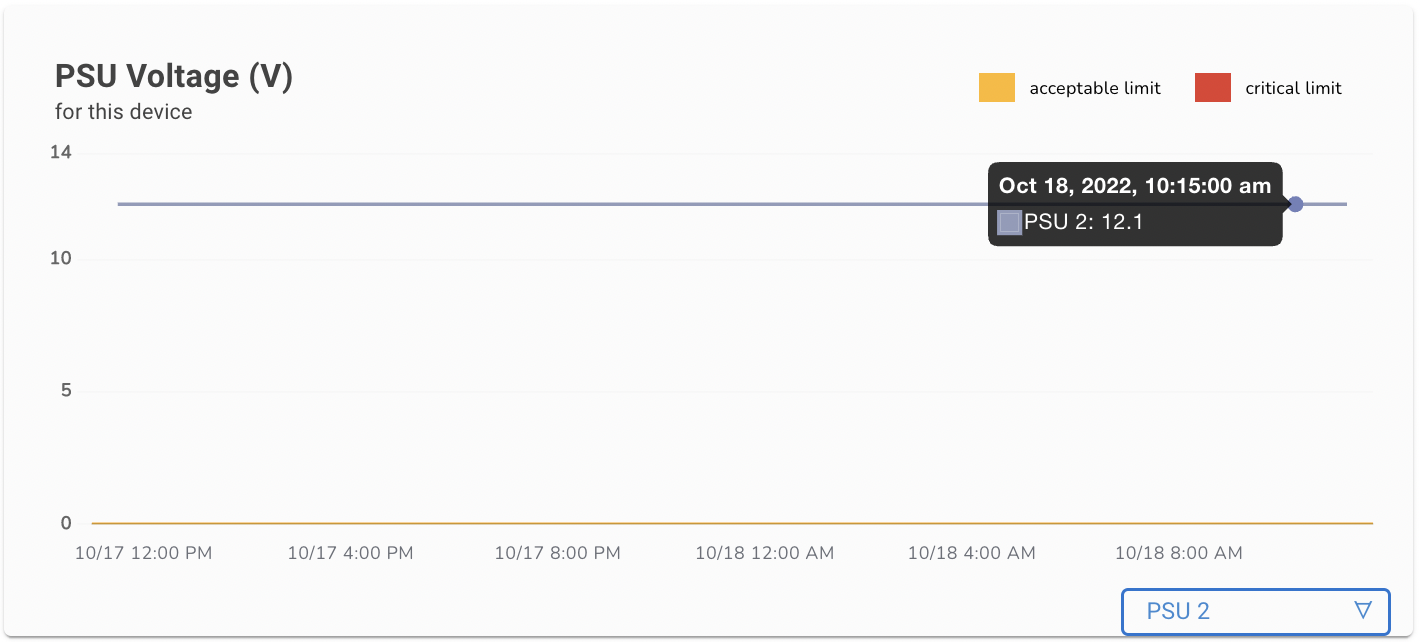
#### PSU Voltage (V)
* This widget provides the status of the Power Supply Unit (PSU) voltage across all power supplies available on a particular device.
* To check a specific time detail we can hover the cursor on any level
* Same we can check the customized view by choosing one or two PSUs
* Let us choose one of the PSU to check individual Voltage, so here we have taken PSU2 to check individual Voltage
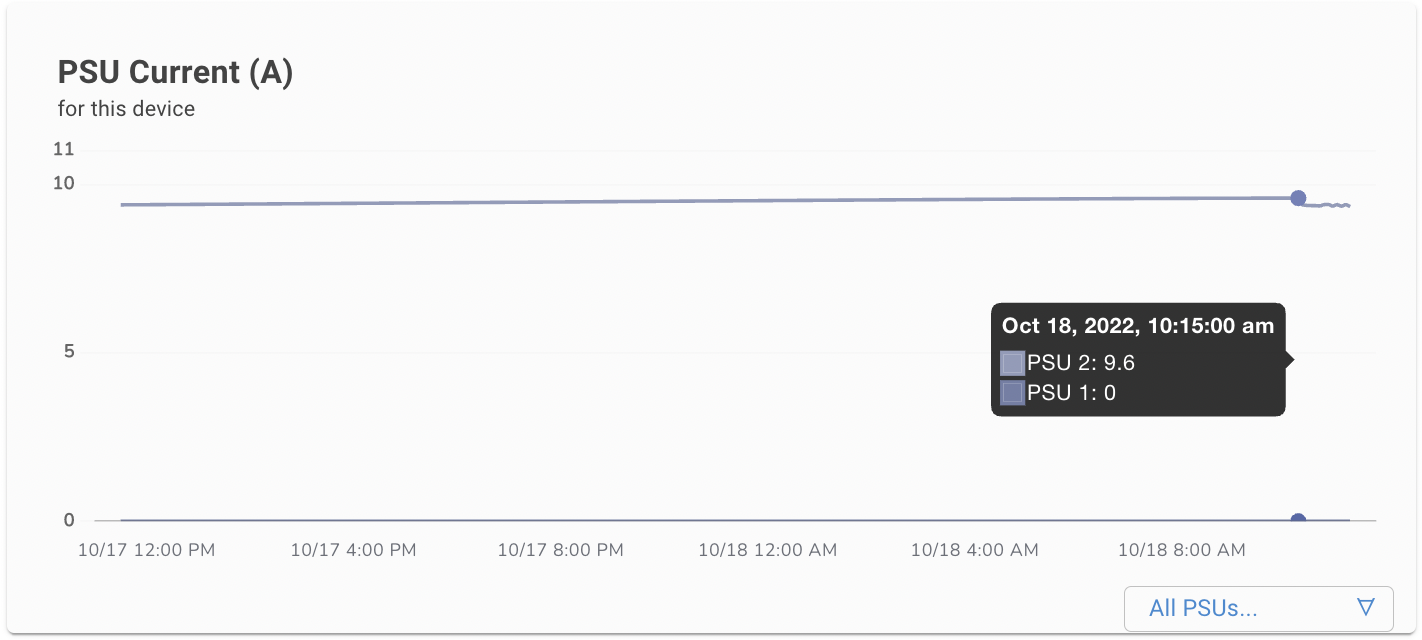
#### PSU Current (A)
* This widget provides the status of the Power Supply Unit (PSU) current in Amperes, across all PSUs available on a particular device.
* To check a specific time detail, hover the cursor on any level
* Same here as per other power supply customized views we can also check the customized view here by choosing specific PSUs
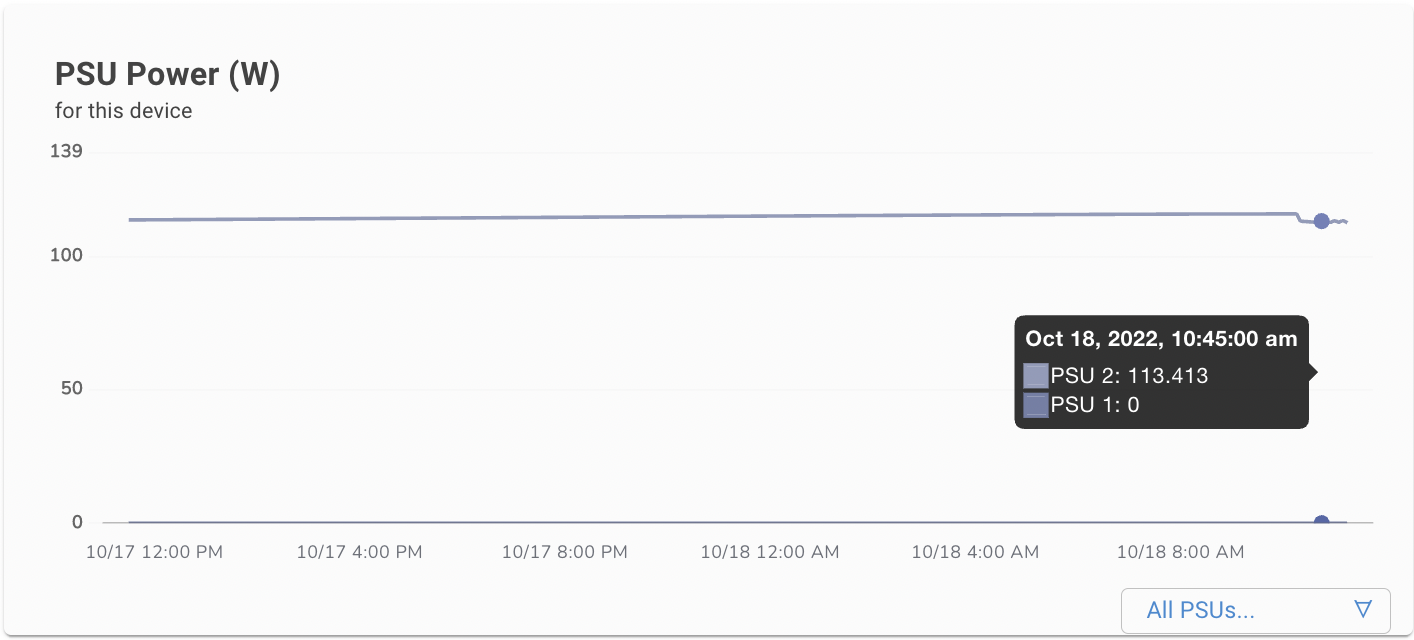
#### PSU Power (W)
* Here we get the status of Power supply power in Watt across all power supply present on the device
* To check a specific time detail we can hover the cursor on any level
* We can also check the customized view of this
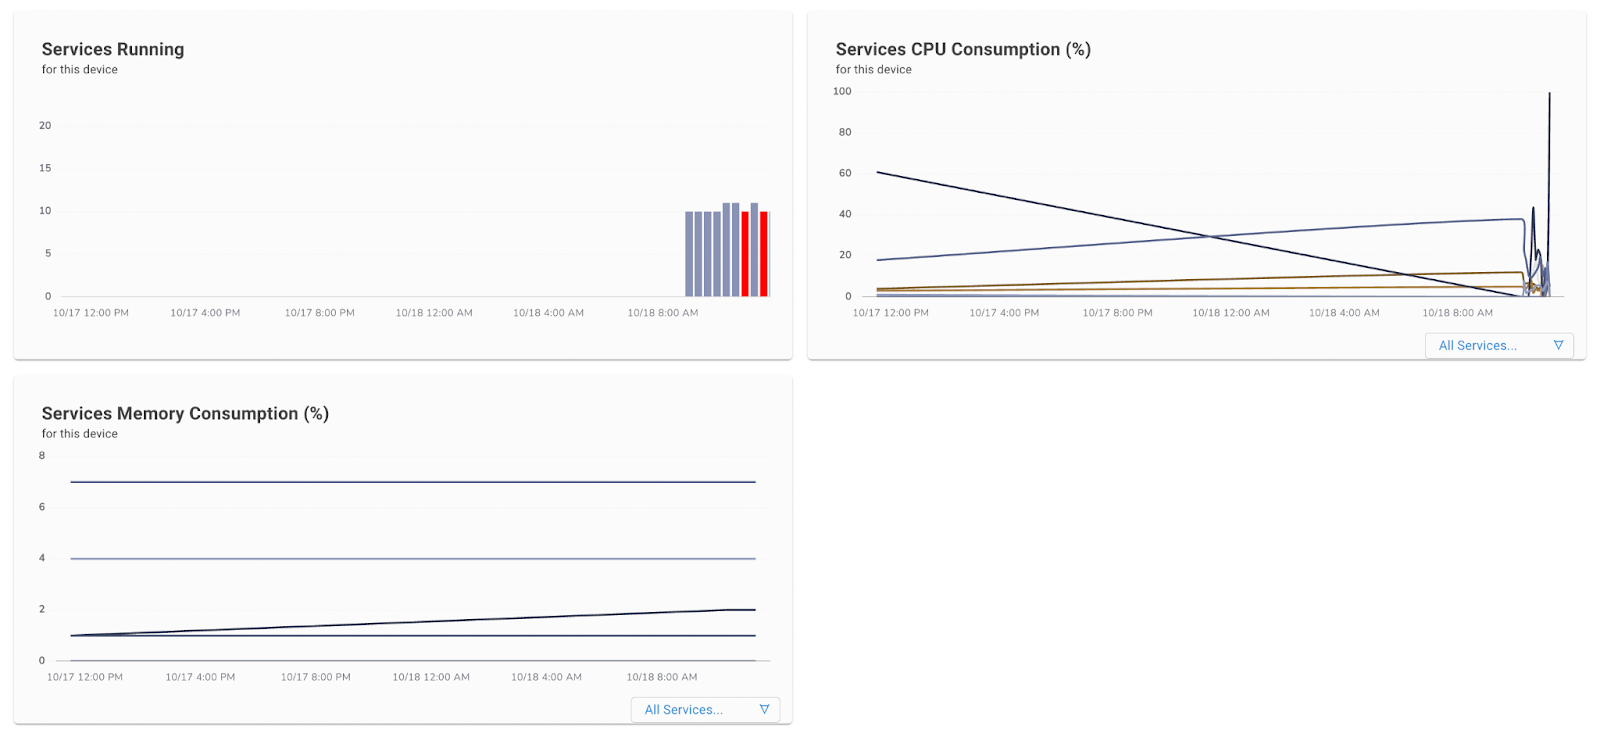
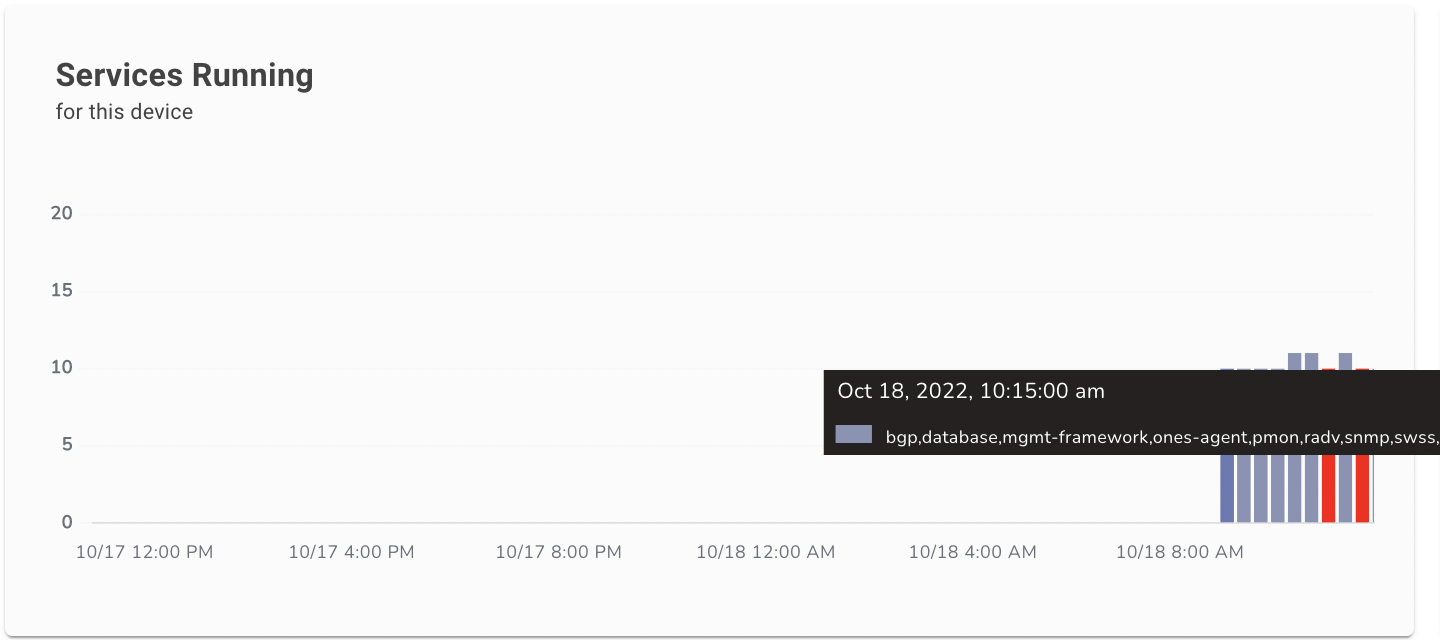
#### Services Running
* The best widget here for Services
* We can also check the total number of count of services running on the platform
* This graph shows the red colour bar, red colour show at what time one of the services went down
* To check a specific time detail we can hover the cursor on any level
* Here we get the name and count of all the services running on the platform
#### Services CPU Consumption (%)
* This widget shows us the CPU consumption percentage level of all services / per service.
* Here we can see we have the option to check the consumption view of CPU
* To check a specific time detail we can hover the cursor on any level
* When we get this output we get a clear view of both CPU Utilization per service based
* We can also customise the view of this widget by choosing some specific application
* We have all the services button here to choose
* Again we can check the view of all the services we need
* So here is the view of only the BGP service
* We can see the CPU and Memory consumption for these 2 services
#### Services Memory Consumption (%)
* This widget shows us the Memory consumption percentage level of all services / per service.
* Here we can also check the consumption view of only Memory.
* To check a specific time detail we can hover the cursor on any level
* Here we get a clear view of Memory Utilization per service based
* We can also customise the view of this widget by choosing some specific application
* We have all the services button here to choose
* So here is the view of only the BGP service
## ASIC
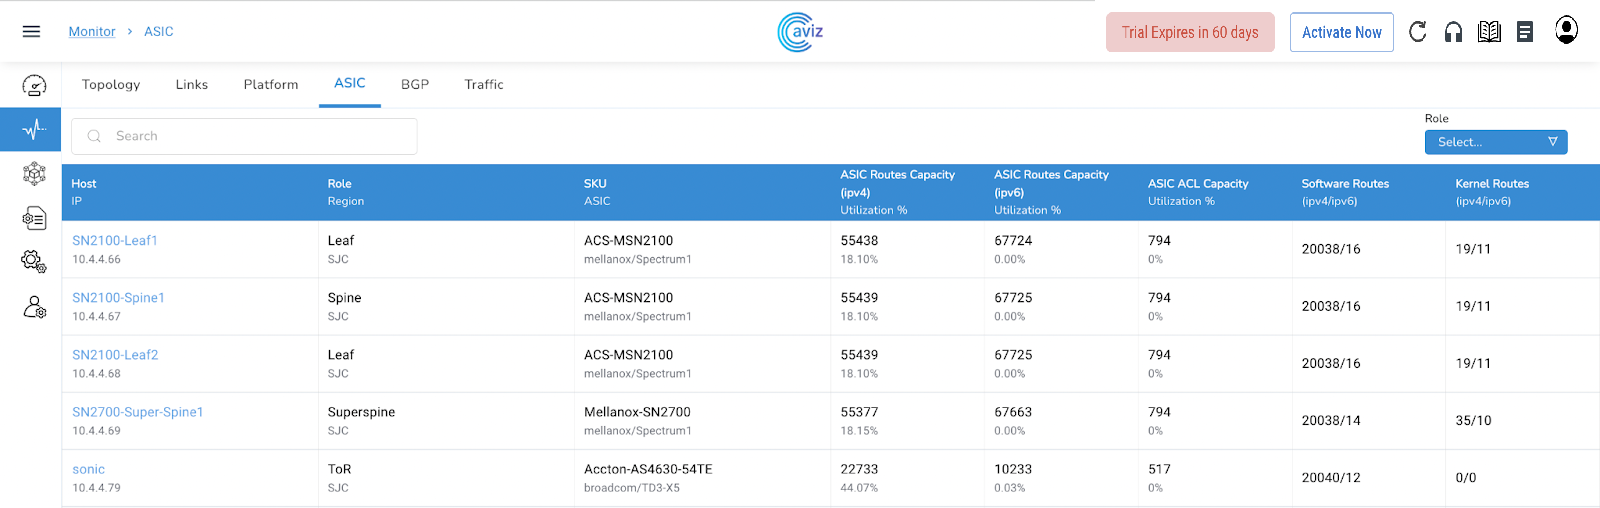
This page shows the view of ASIC Capacity and a few more details related to ASIC
* This widget Shows
* Roles/Region per device
* SKU and ASIC details per device
* ASIC Route Capacity in IPv4 & current utilization
* ASIC Route Capacity in IPv6 & current utilization
* ASCI ACL capacity & utilization
* Software routes for IPv4 and IPv6
* Kernel Routes for IPv4 and IPv6
| Feature | Details |
| ----------------------------------------------------------------------------------------- | --------------------------------------------------------------------------------------------------------------------------------------------------------------------------------------------------------------------------------- |
| Roles/Region per device |  |
| SKU and ASIC details per device |  |
| ASIC Route Capacity in IPv4 & current utilization |  |
| ASIC Route Capacity in IPv6 & current utilization |  |
| ASCI ACL capacity & utilization |  |
|
Software routes for IPv4 and IPv6 routes we get in BGP table
Kernel Routes for IPv4 and IPv6 routes that are installed in main Routing table
|  |
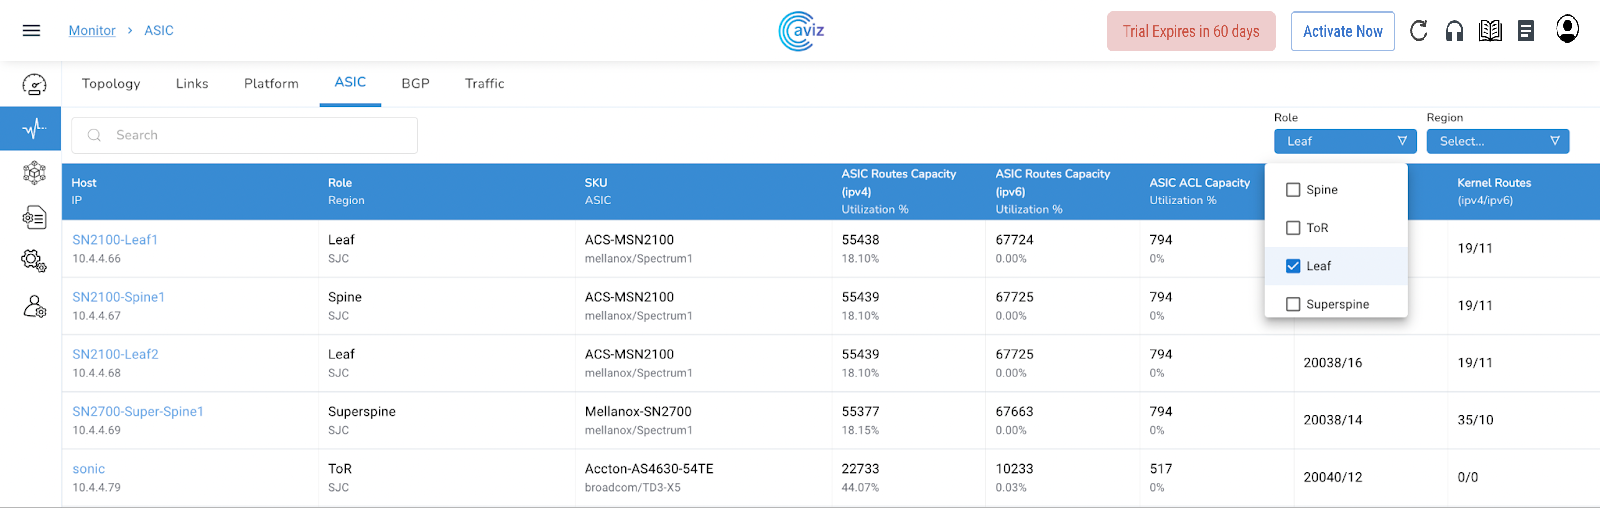
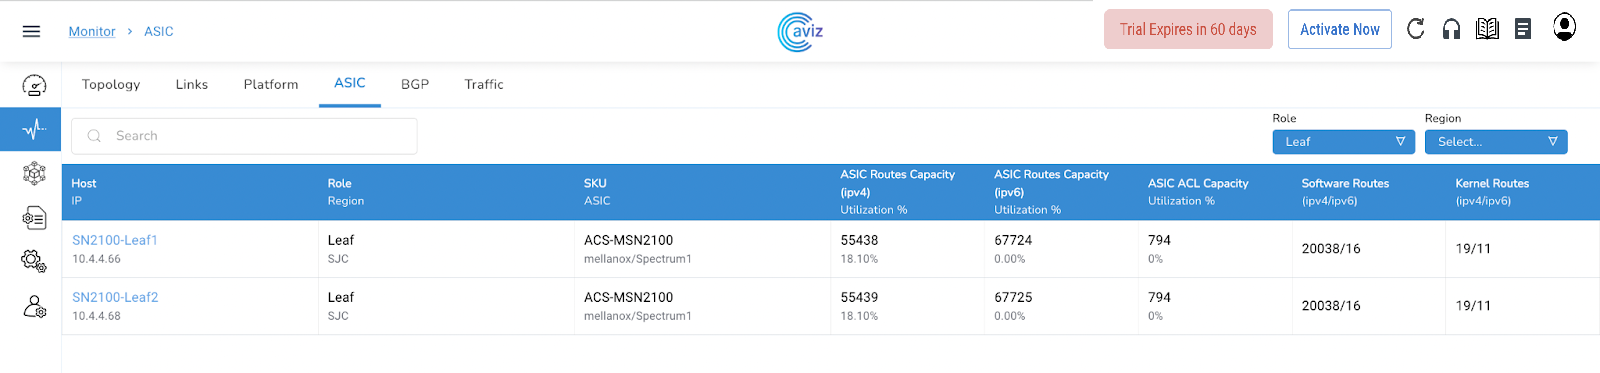
This ASIC Widget give us the control to get the output per Role and Region basis also
* Let's choose Leaf Role to get the customized view
* **In the same way, we can customize the view by Region**
{% hint style="info" %}
This is the extended view of the device capacity for all the IPv4 and IPv6 ASIC routes, ACL utilization, software, and kernel routes
Using this page a user will be able to troubleshoot the protocol or any misbehavior happening on the devices due to any capacity issue of routes
{% endhint %}
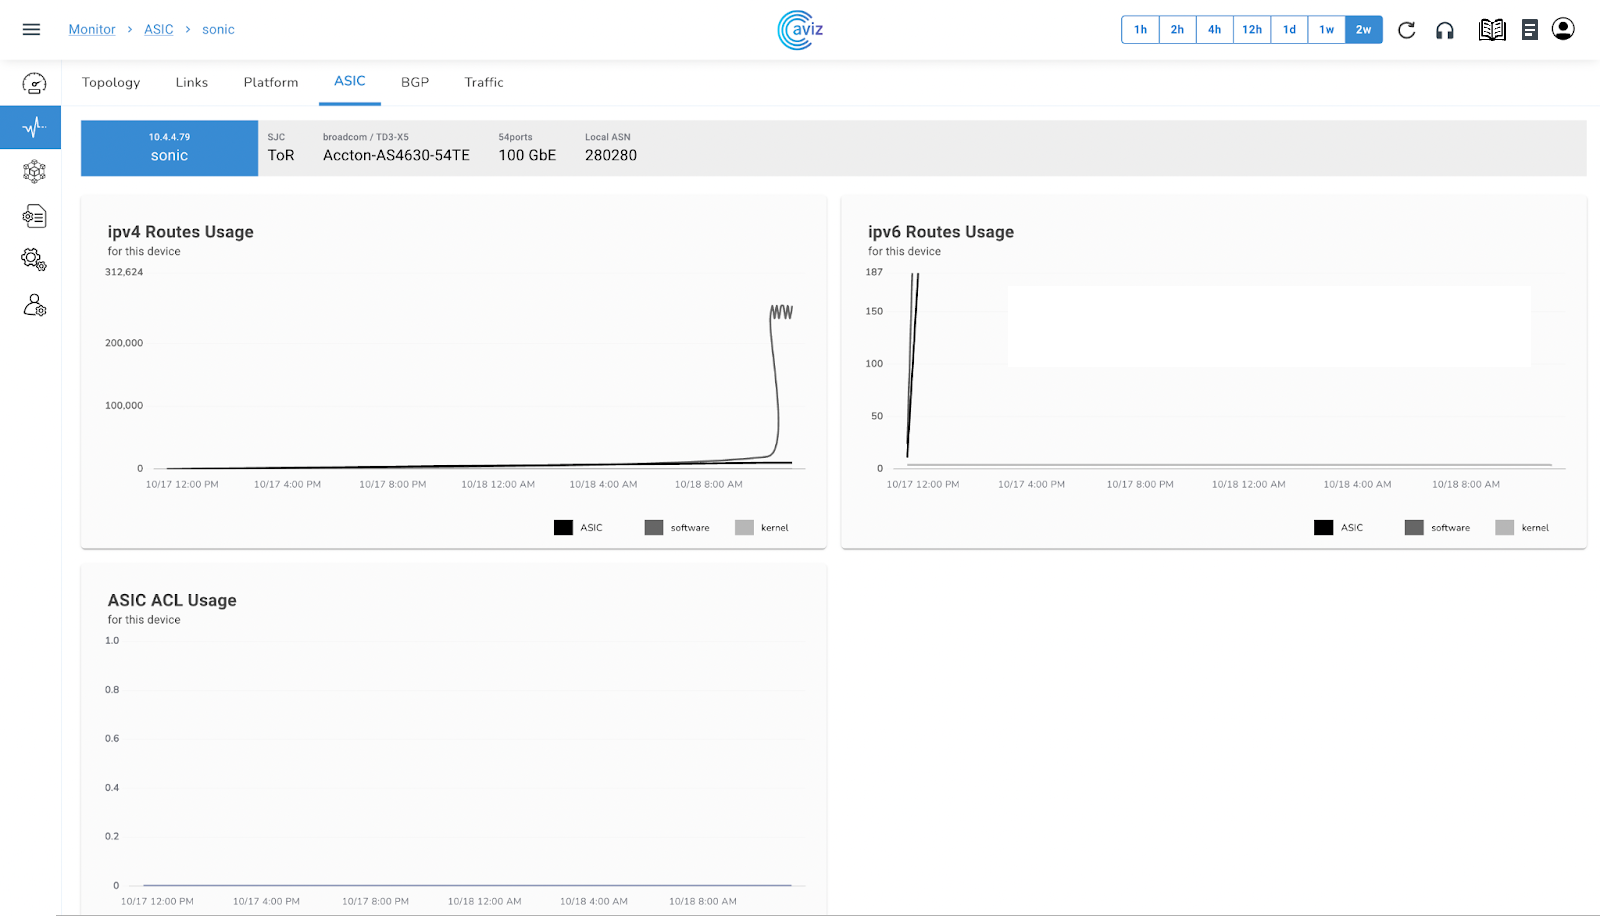
### Per Device Status
This widget gives us the capability to check the extended view of the Routes & ACL usage with a range of time
Click on any of the devices to get the extended view
| Feature | Use |
| ----------------------------------------------------------------------------------------------------------------------------------------------------------------------------------------------------------------------------------- | ------------------------------------------------------------------------------------------------------------------------------------------------------------ |
|  |
When we move the cursor to metrics this gives the usage view of ipv4:
When we move the cursor to metrics this gives the usage view of ACL:
ASIC
Kernel
Software
|
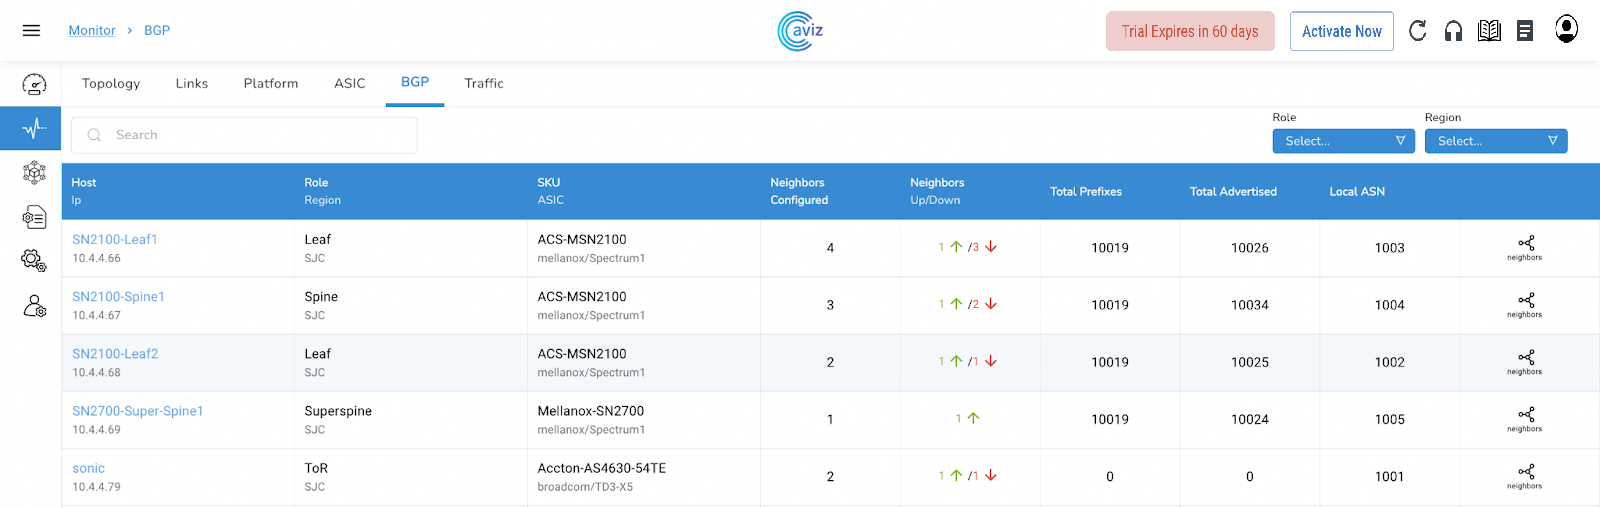
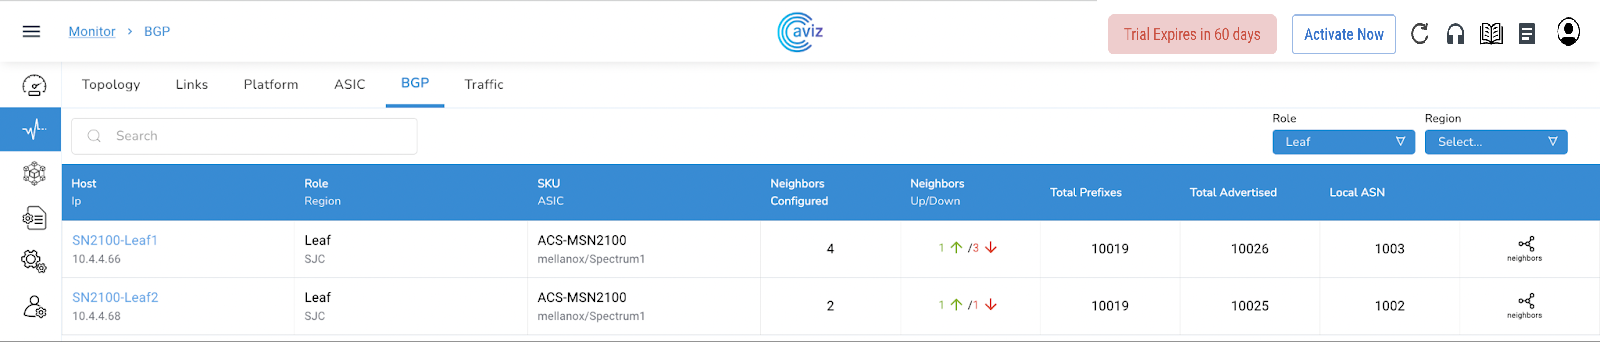
## BGP
This BGP Page shares the data of BGP neighbours present across managed devices
Feature
Feature
Here we can get:
Device name
Device IP
Here We get the view of:
Roles and Region
this column shares the details of:
SKU
ASIC
This shared the count of total BGP neighbours
This column share the status of
how many BGP neighbours are UP and running
How many BGP neighbours are in Down state
This column shares the Total Prefixes Present in BGP
These are the total number of advertised prefixes by the router to other BGP neighbours
This is the Local BGP AS number
Here we have the control to check more details on neighbours
{% hint style="info" %}
This page gives the best details of the BGP neighbours connected with the devices and possible metrics/values a user can use to troubleshoot a BGP neighbour
{% endhint %}
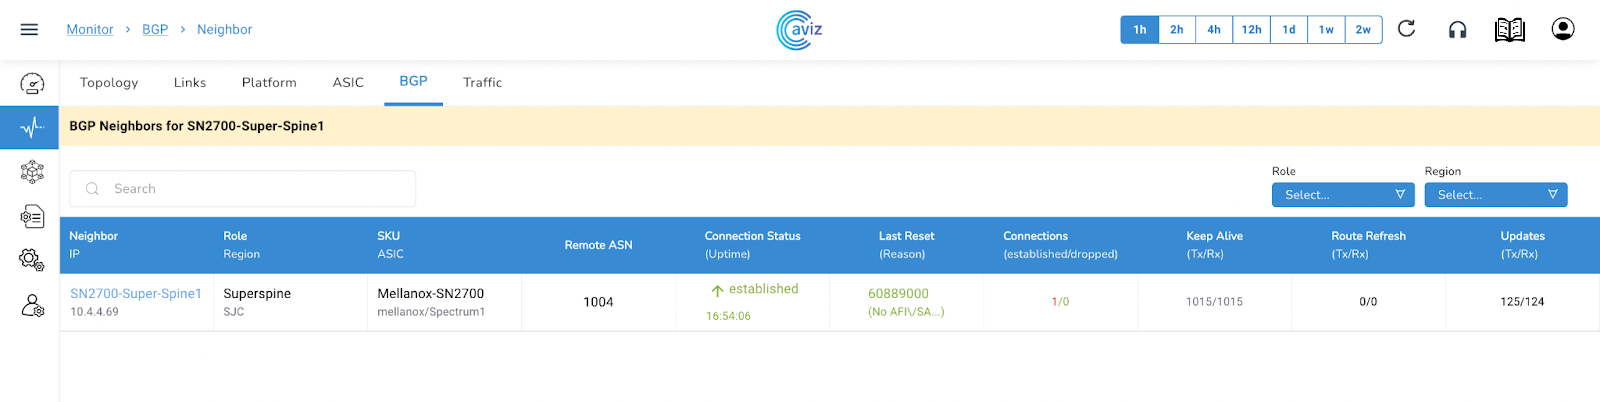
### Neighbor View
This shows the status of the neighbour's details, the total number of neighbours, received routes, neighbour RID, BGP AS number & much moreWe have the option here to check the neighbour details and status of RoutesWe can click on neighbours to get more details about all neighbours connected
| Feature | Feature |
| ----------------------------------------------------------------------------------------------------------------------------------------------------------------------------------------------------------------------------------- | ----------------------------------------------------------------------------------------------------------------------------------------------------------------------------------------------------------------------------------------------------------- |
|  |
Here we get the details of connected neighbours
Neighbour Device Name
Neighbour IP
|
|
This is the view Roles and Region per neighbour basis
Here is the view of the Route Refresh messages count:
Tx: how many Route-Refresh messages have been transmitted
RX: how many Route-Refresh messages have been received
|
|
Here is the view of the Updates Count:
Tx: how many times updates have been transmitted
RX: how many times updates have been received
|
|
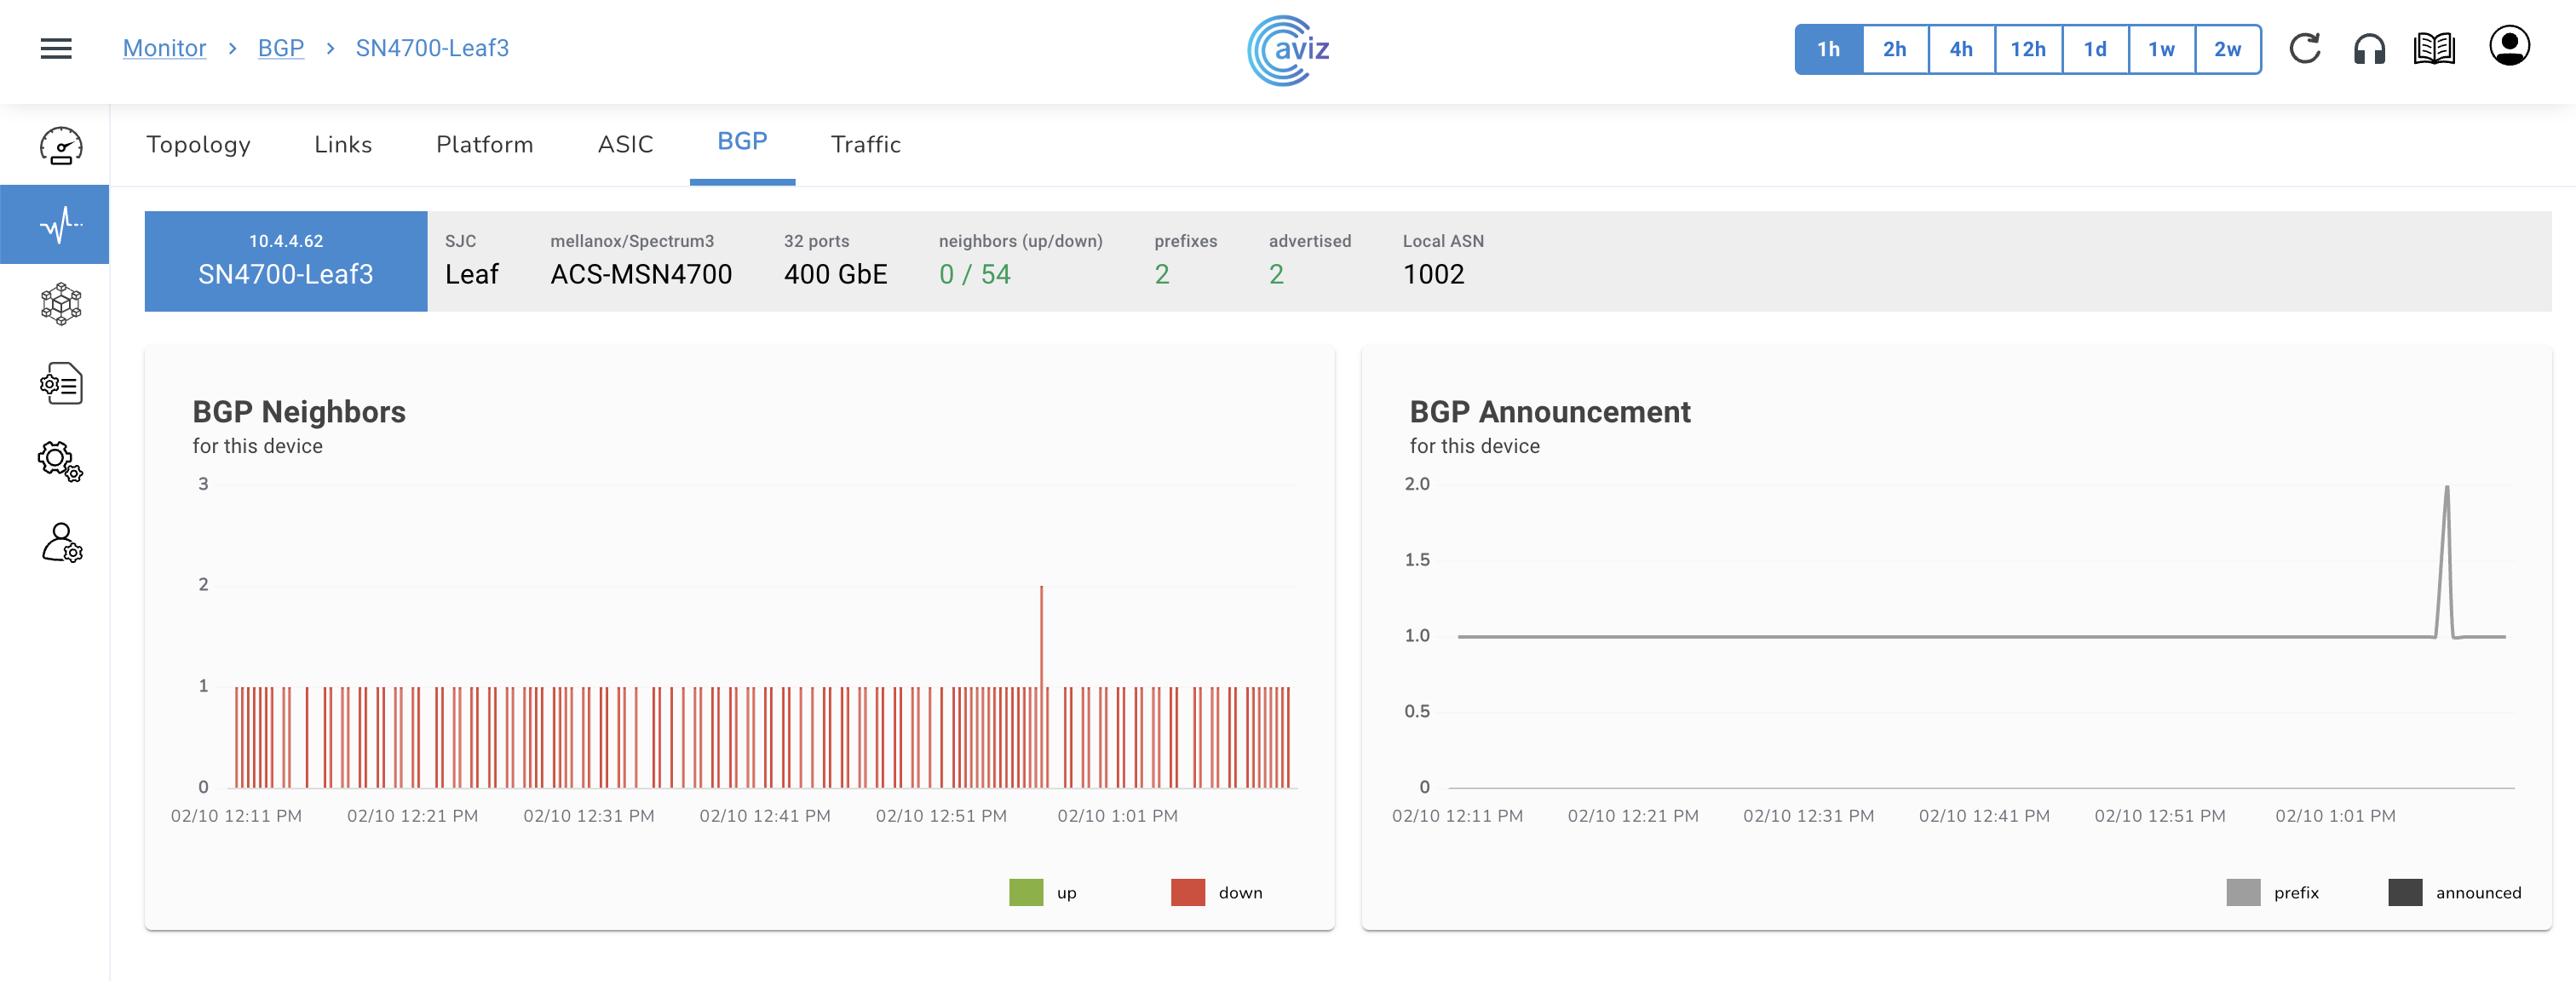
## Per device status (Neighbour's & Announcement)
**The user can get per-device status by choosing a particular neighbour**
* Click on the device name to get the status
* This new page shows the status of BGP neighbours about **UP** and **Down** status
* On right side it shows the BGP announcements and the local prefixes present in BGP table
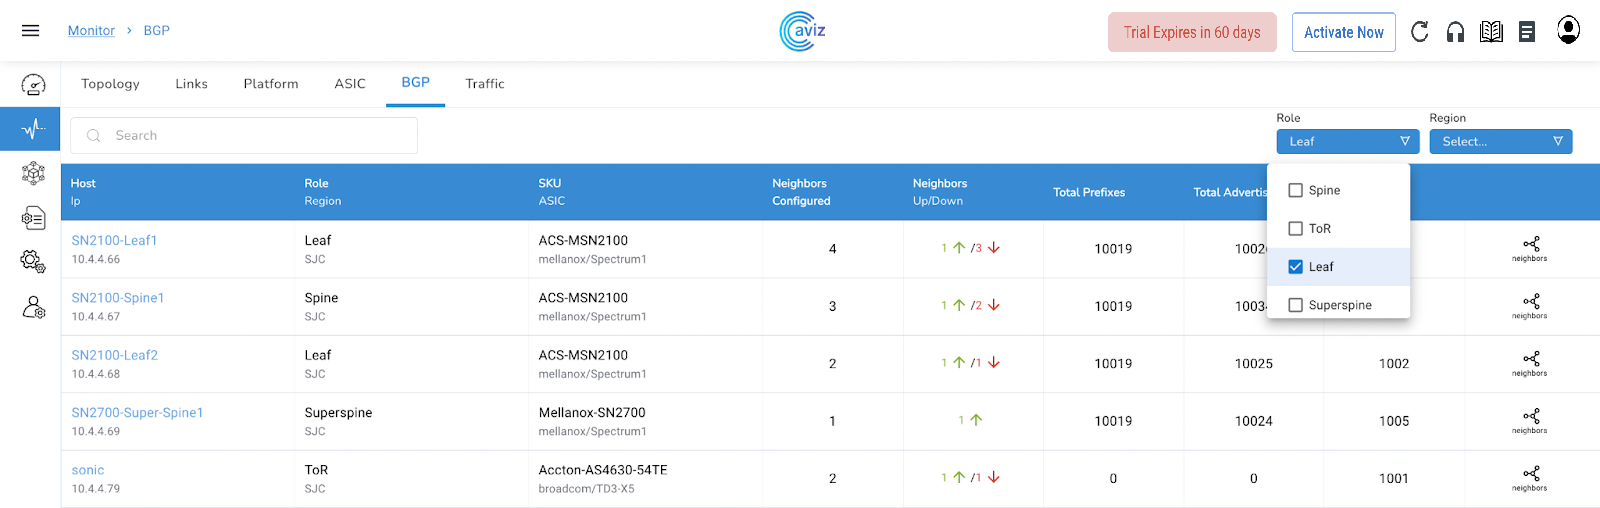
## Customized view
* This page gives us the power to check neighbours as per Roles and Region-based
* Let's check how we can filter as per Role-based
* Here is the global view of all the Devices with BGP status
* Choose Leaf Role to check customized view
* After having only Leaf Roles here is the modified output
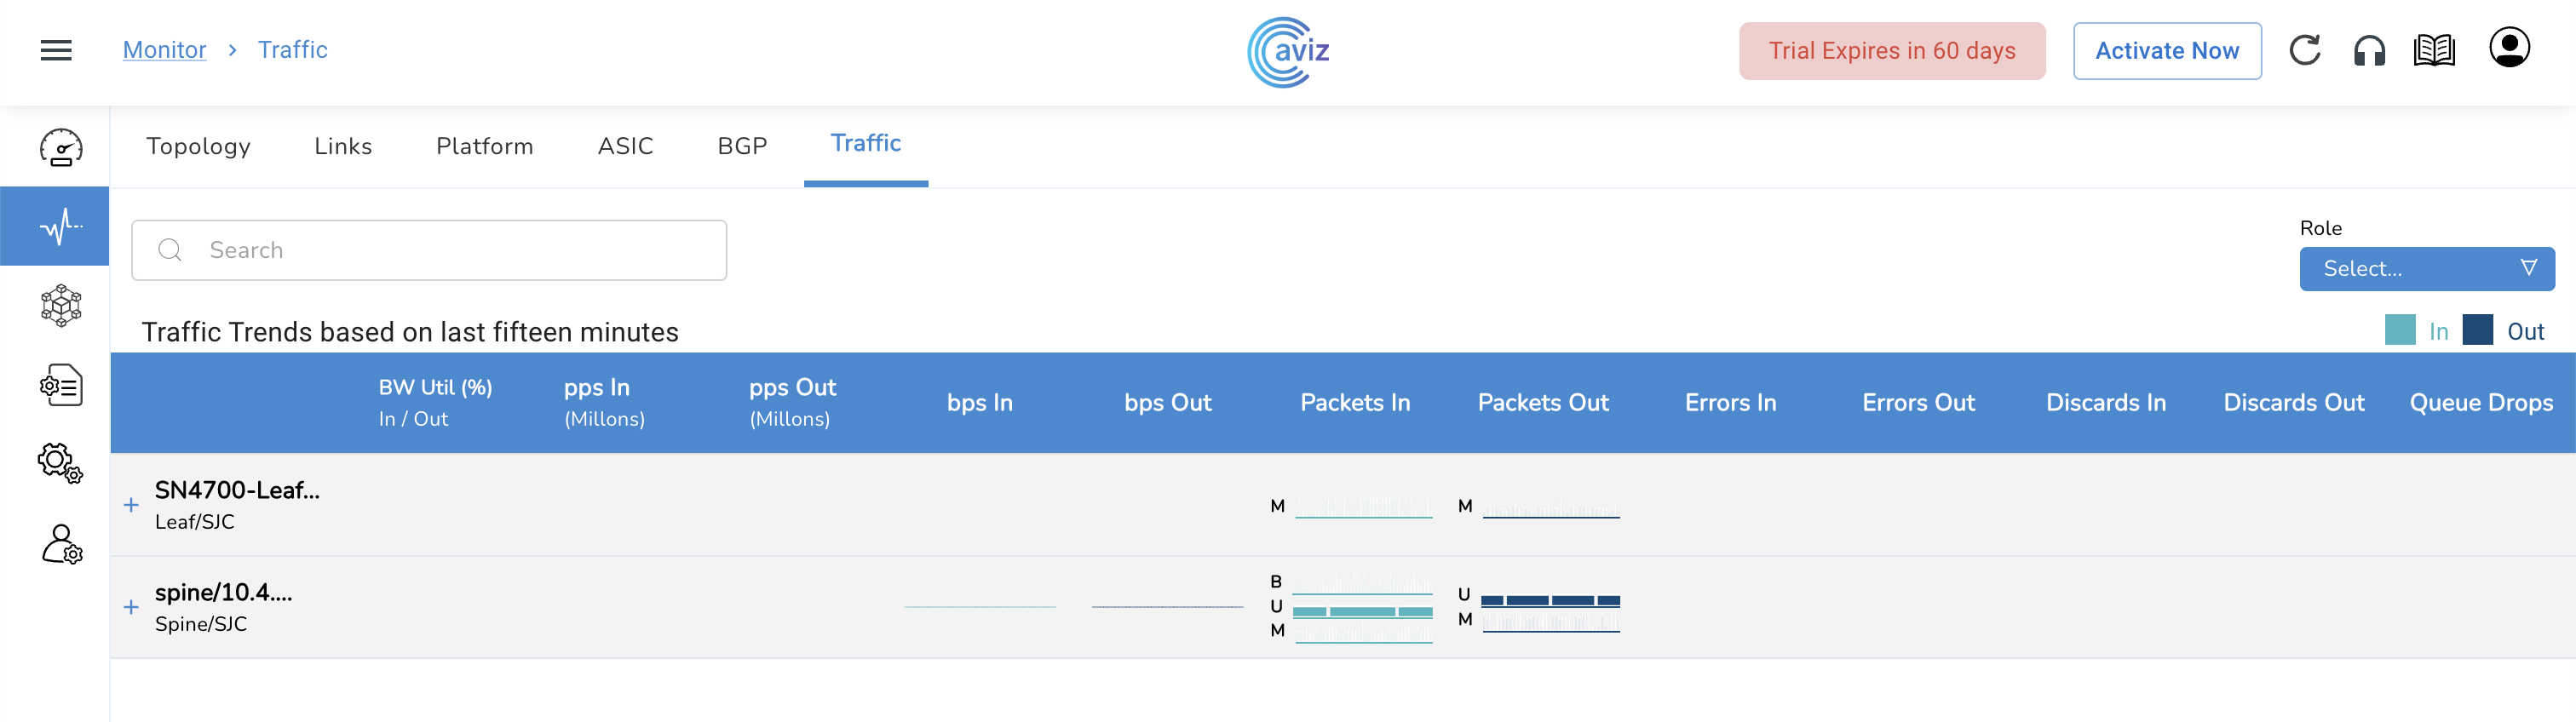
## Traffic
* Using this widget we can check the input and output errors across all the devices
* This widget also shows the input and output packet per device
* Navigate to **Monitor >> Traffic**
* This page shows the information:
* Bandwidth utilization in percentage
* Input packets per second in millions
* Output packets per second in millions
* Input packets
* Output packets
* Input and Output discards
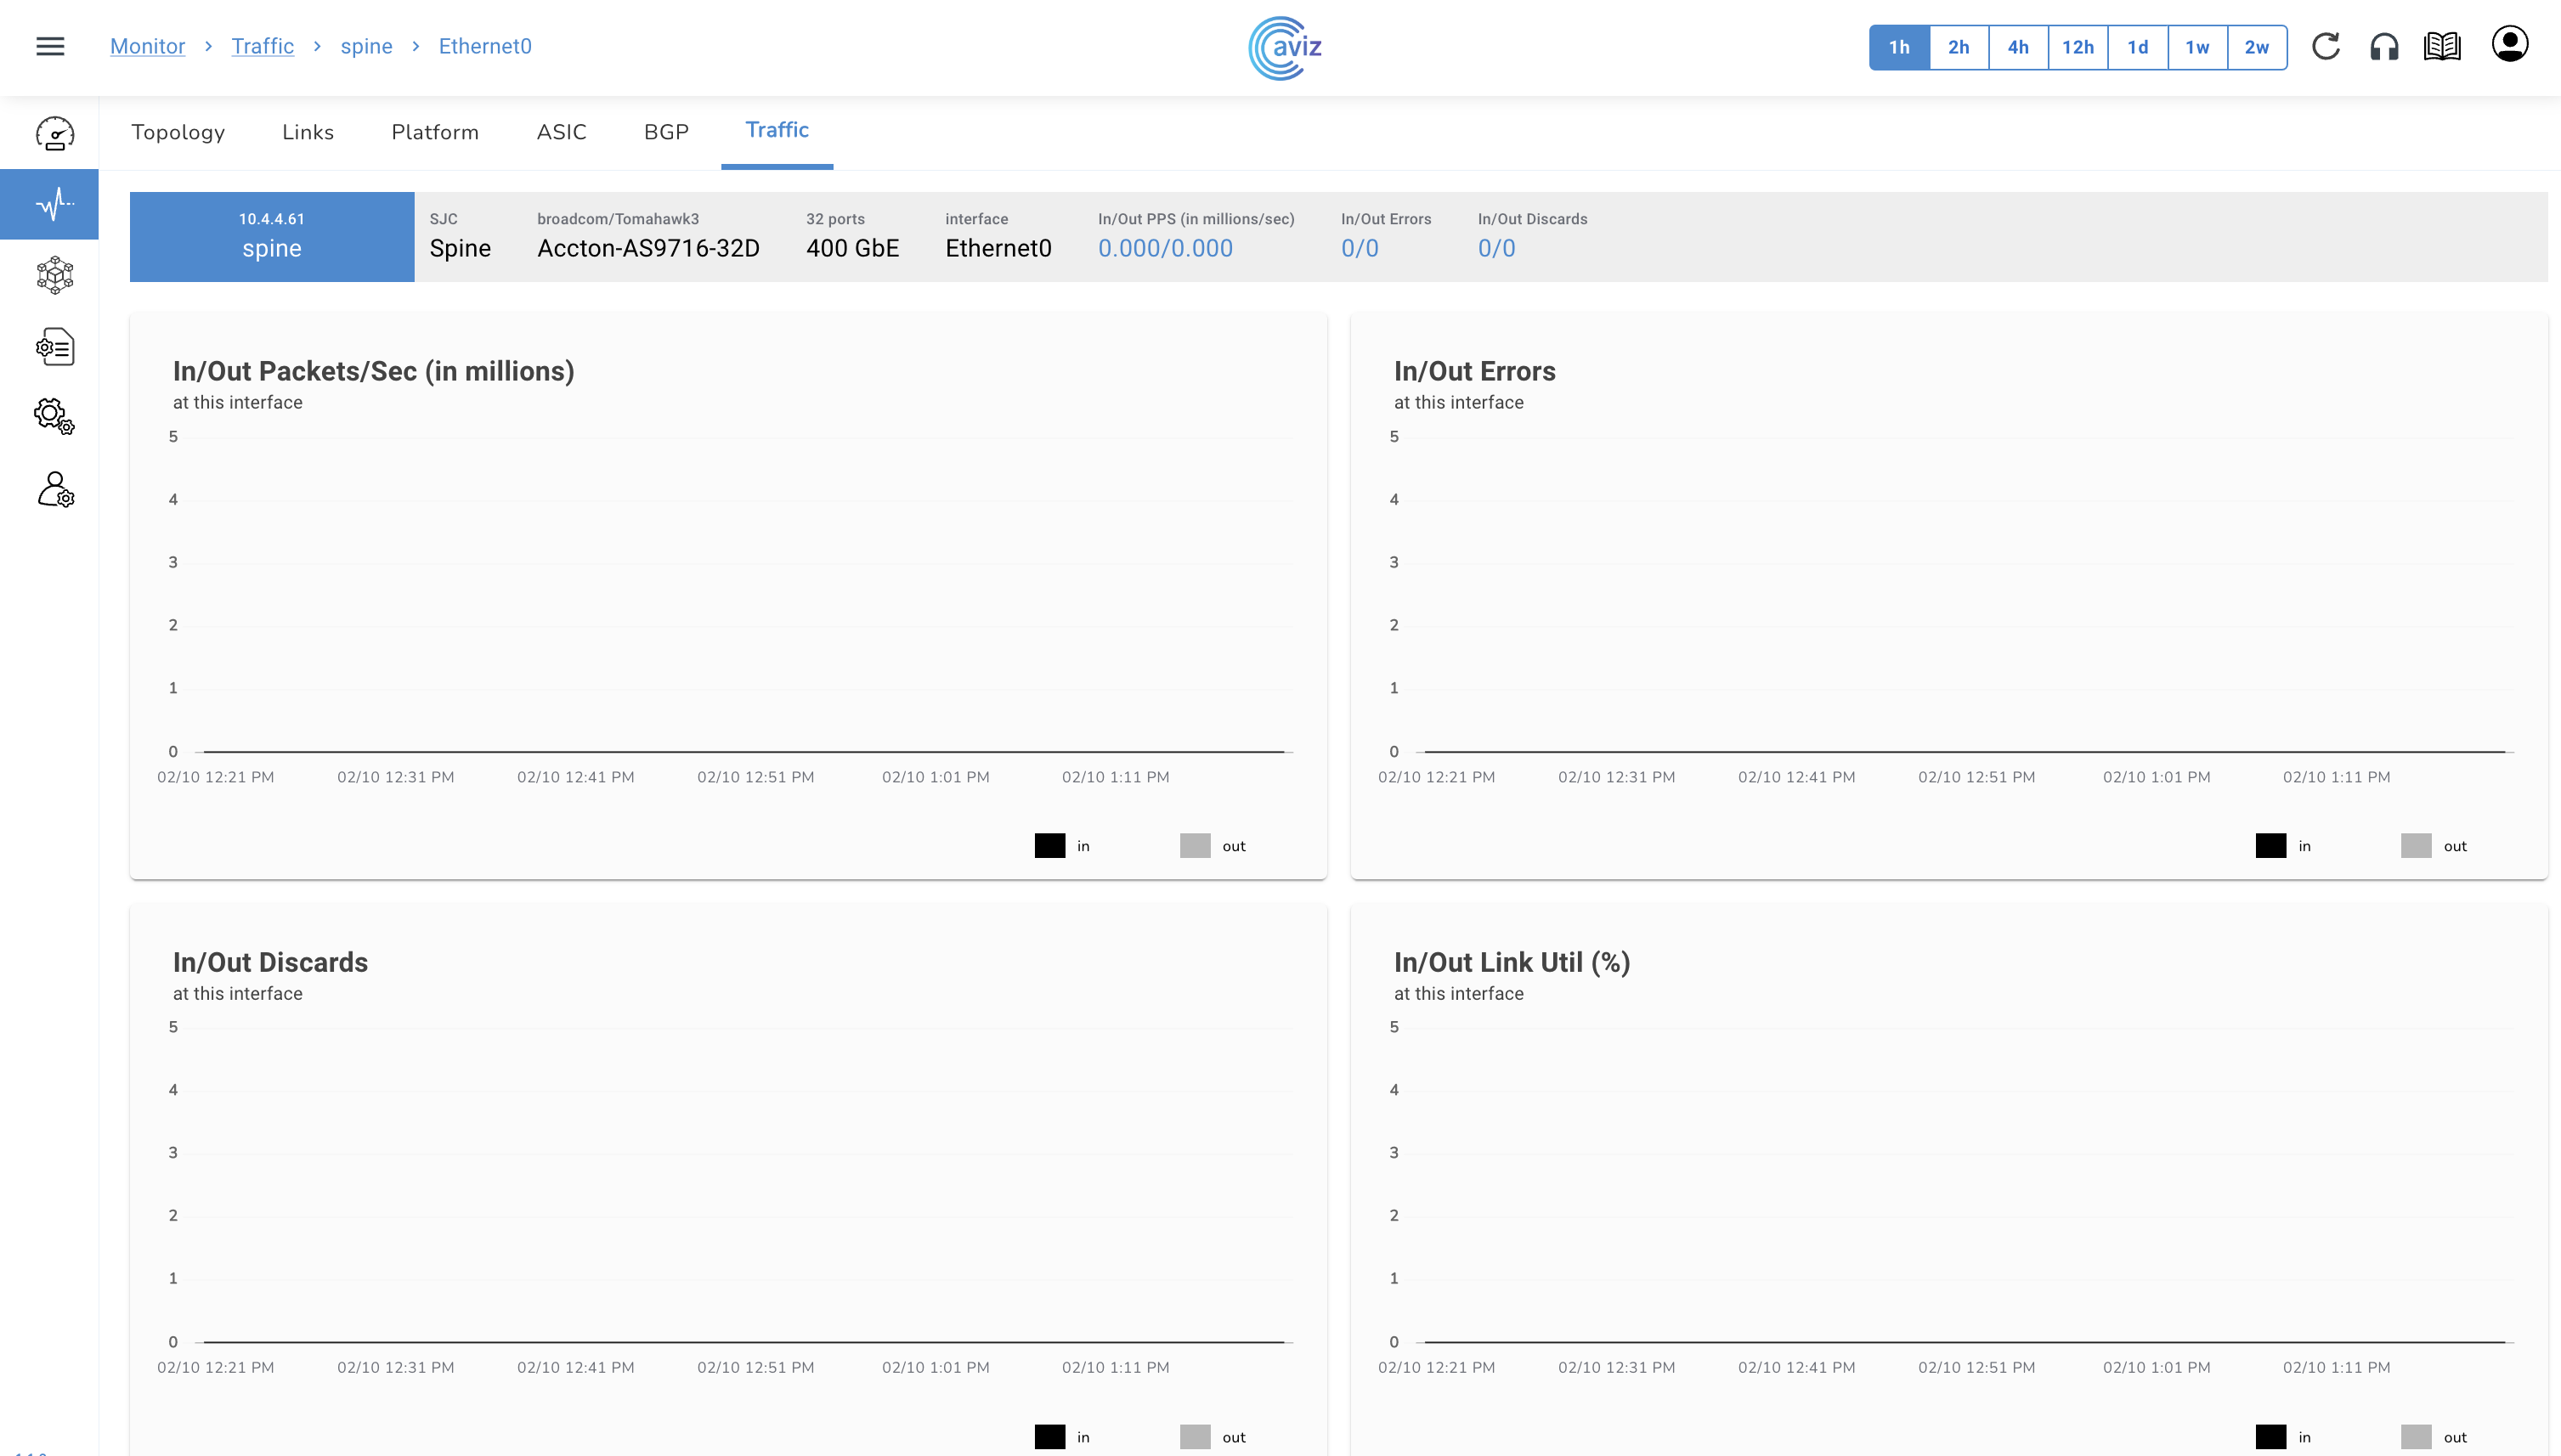
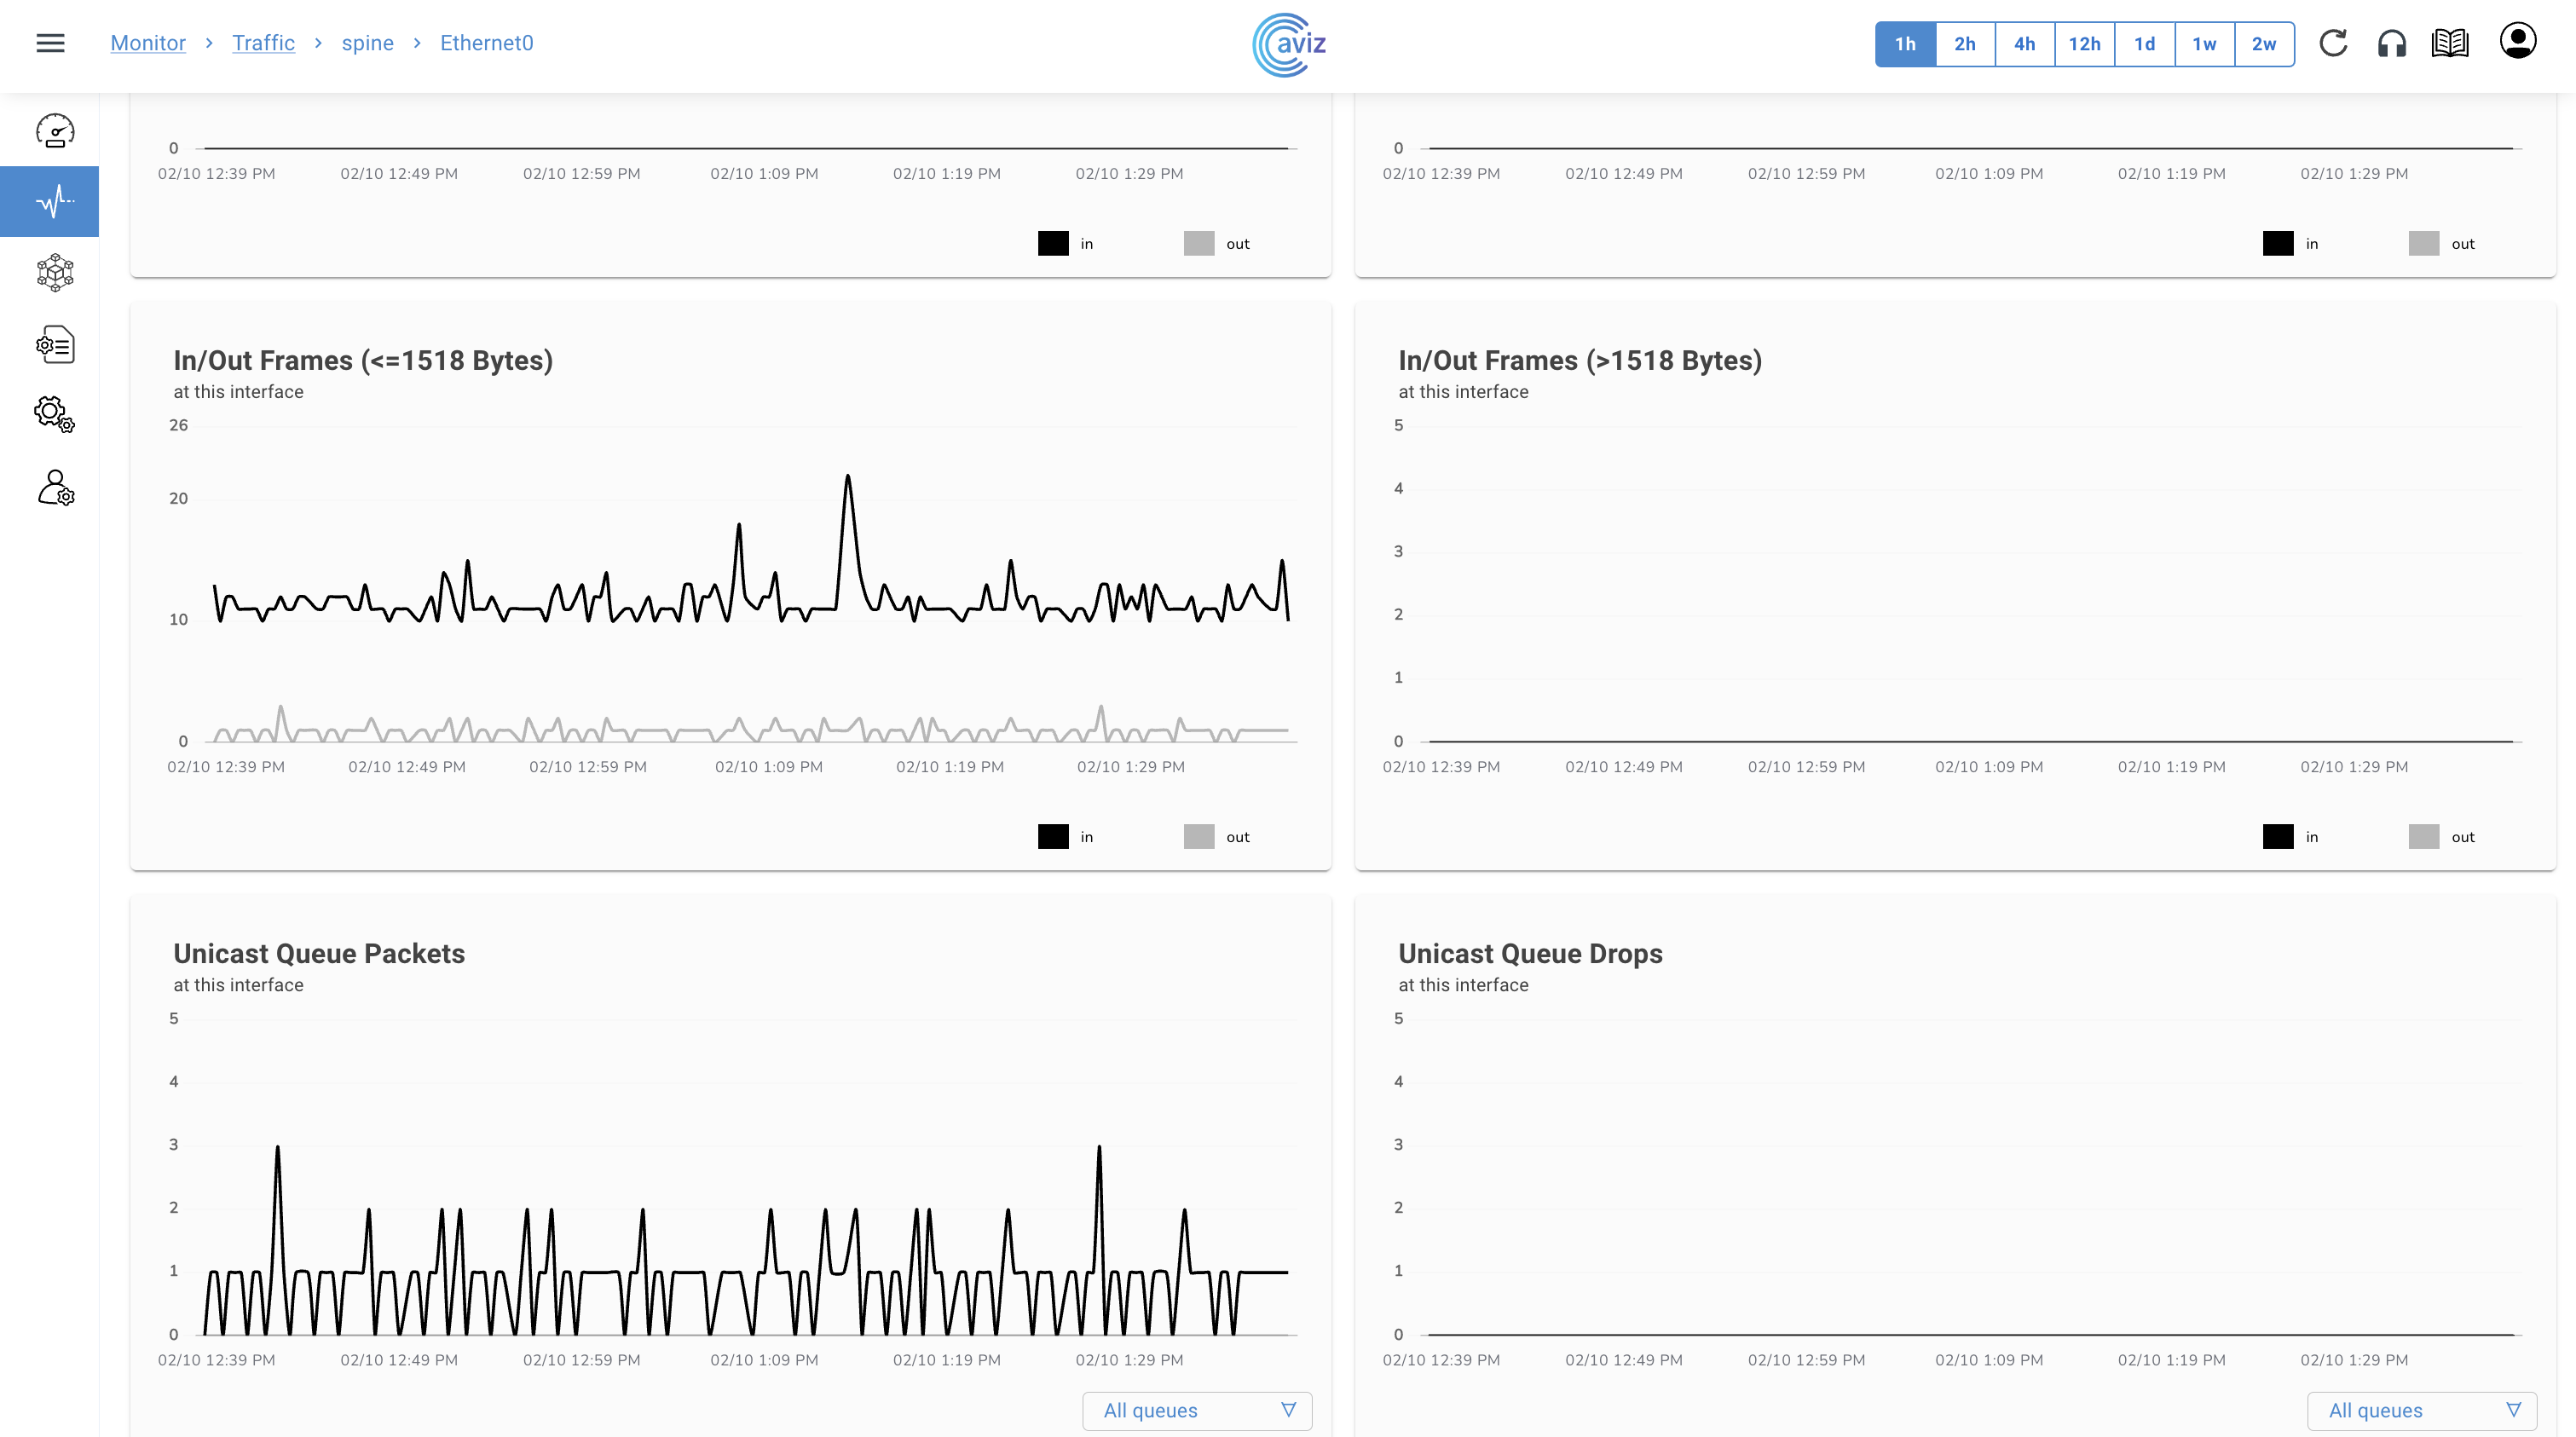
* When we click on any particular interface it gives the timescale of the inputs and output packets with Errors and Discards & all metrics in detail
* This page shows the traffic drop rate per interface based and will be very useful while doing any troubleshooting for a traffic drop
* Using these details a user can check more details inside to fix the issue of dropping/discarding packets