| Feature | Use |
|---|---|
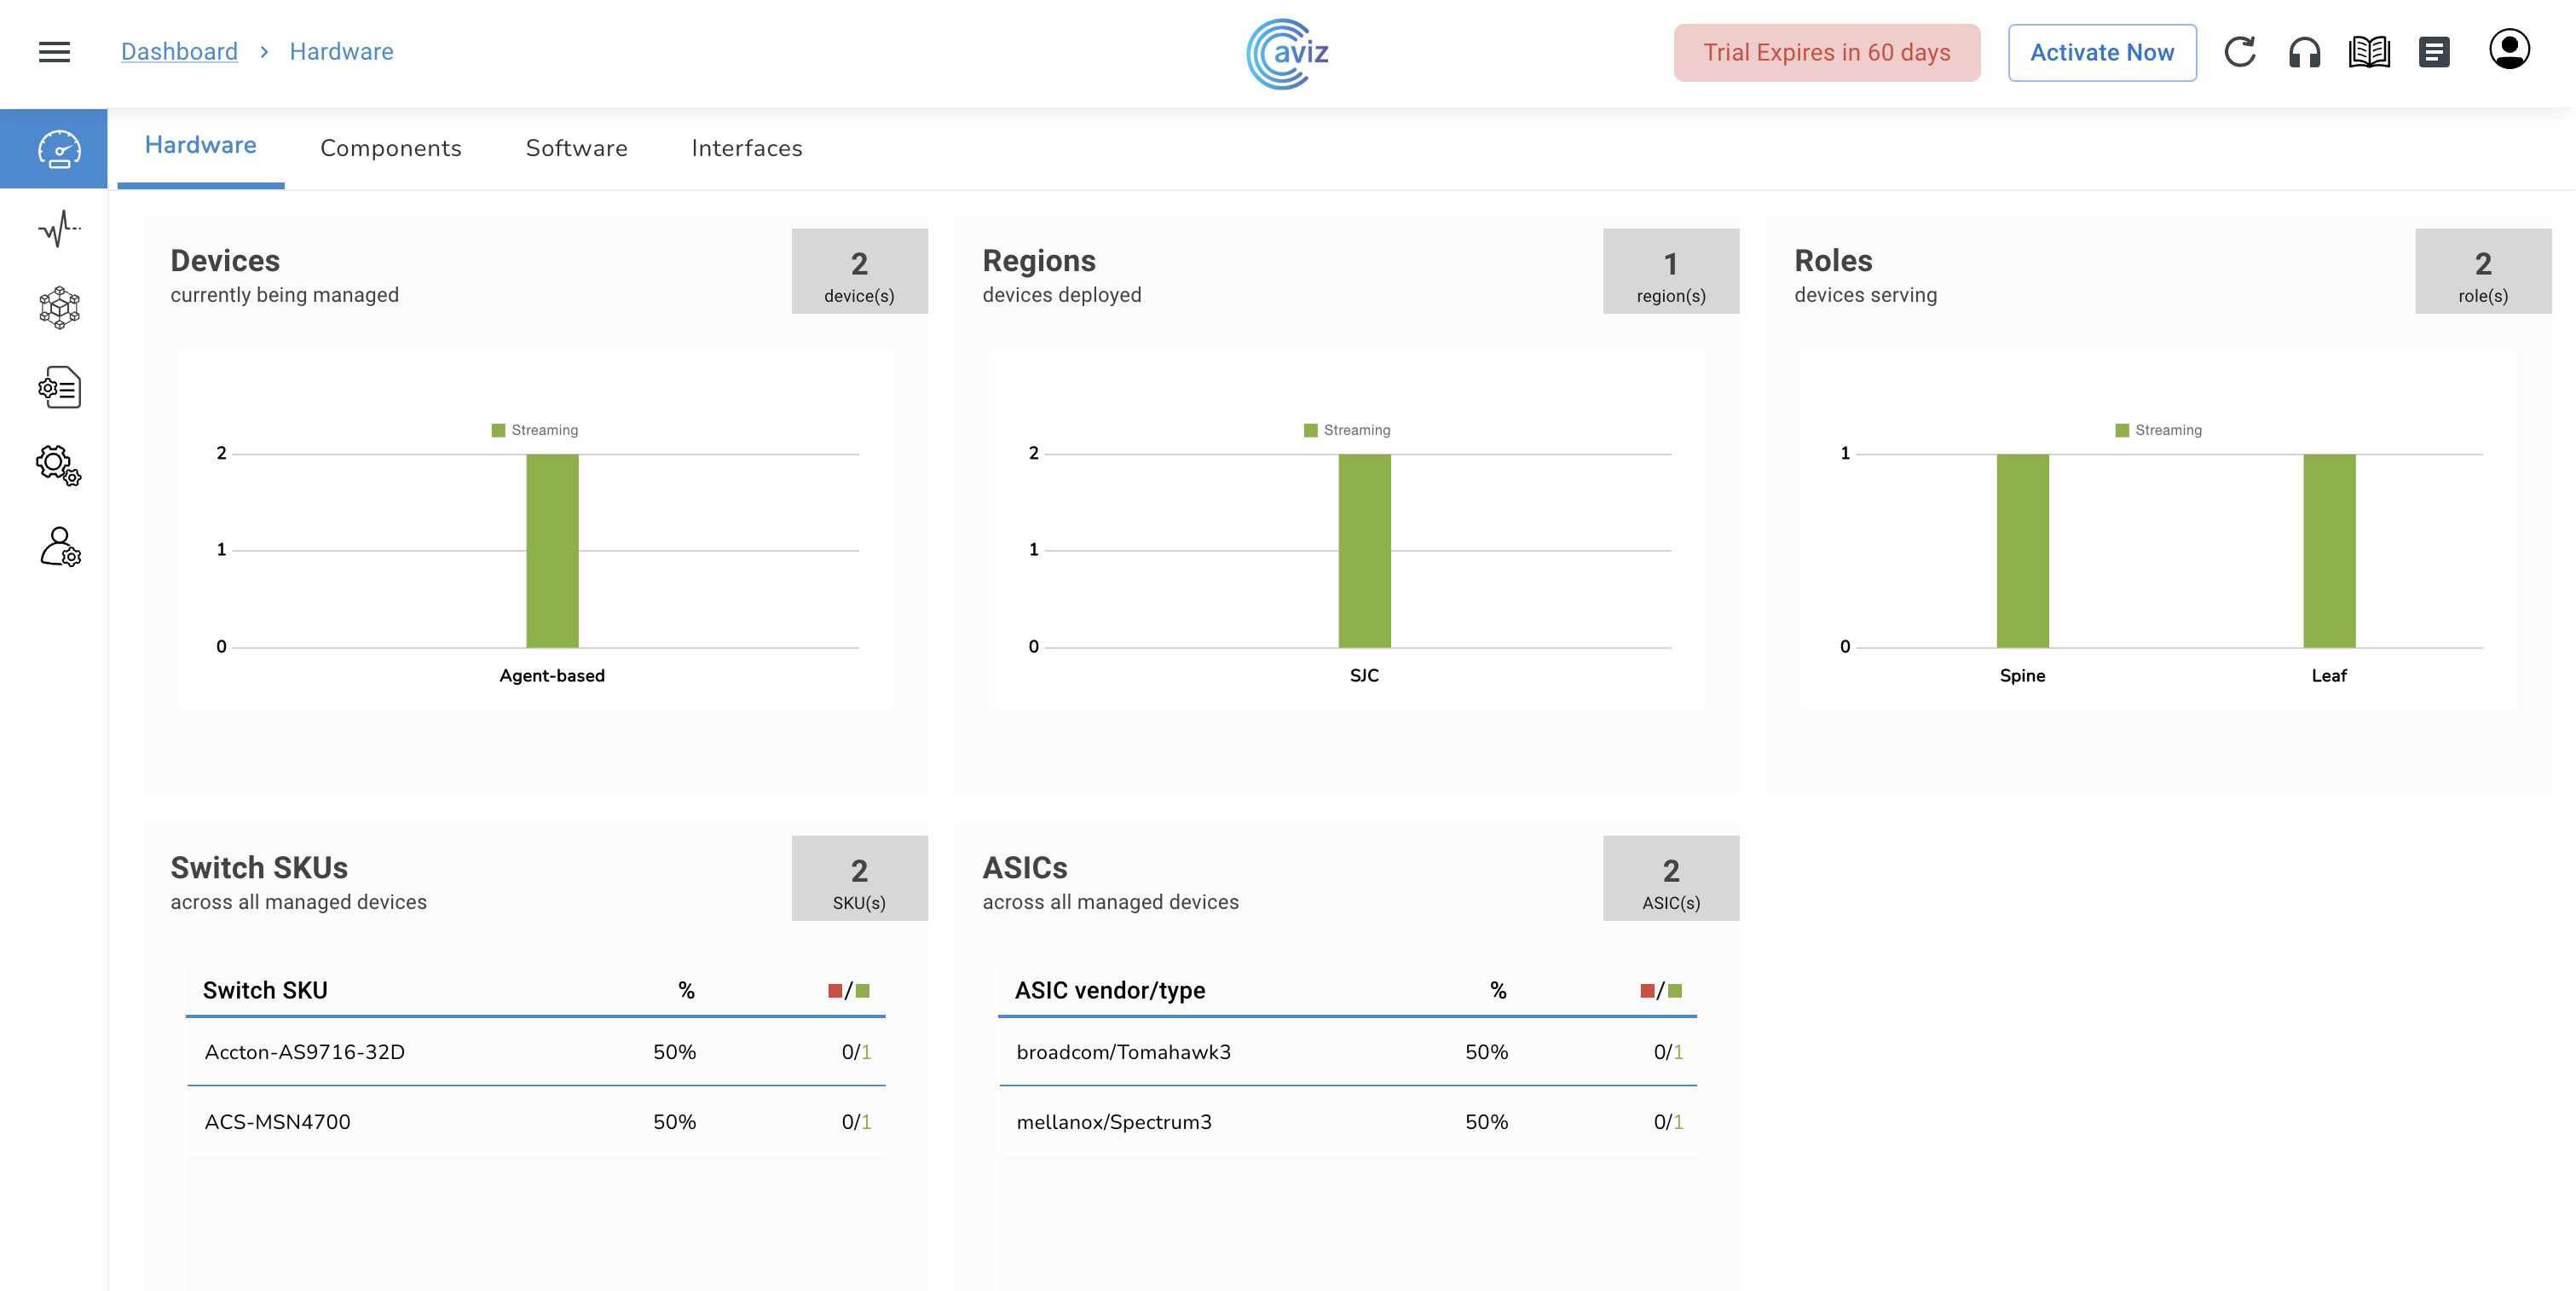
| Devices | Status of Switch
|
| Regions | Status of Regions, their Location and Device Mappings |
| Roles | Device Roles in Customer Environment
|
| Switch SKUs | Switch Hardware Vendor, Model Number and SKU |
| ASICs | ASIC Vendor, Model and Hardware version details |
| Feature | Use |
|---|---|
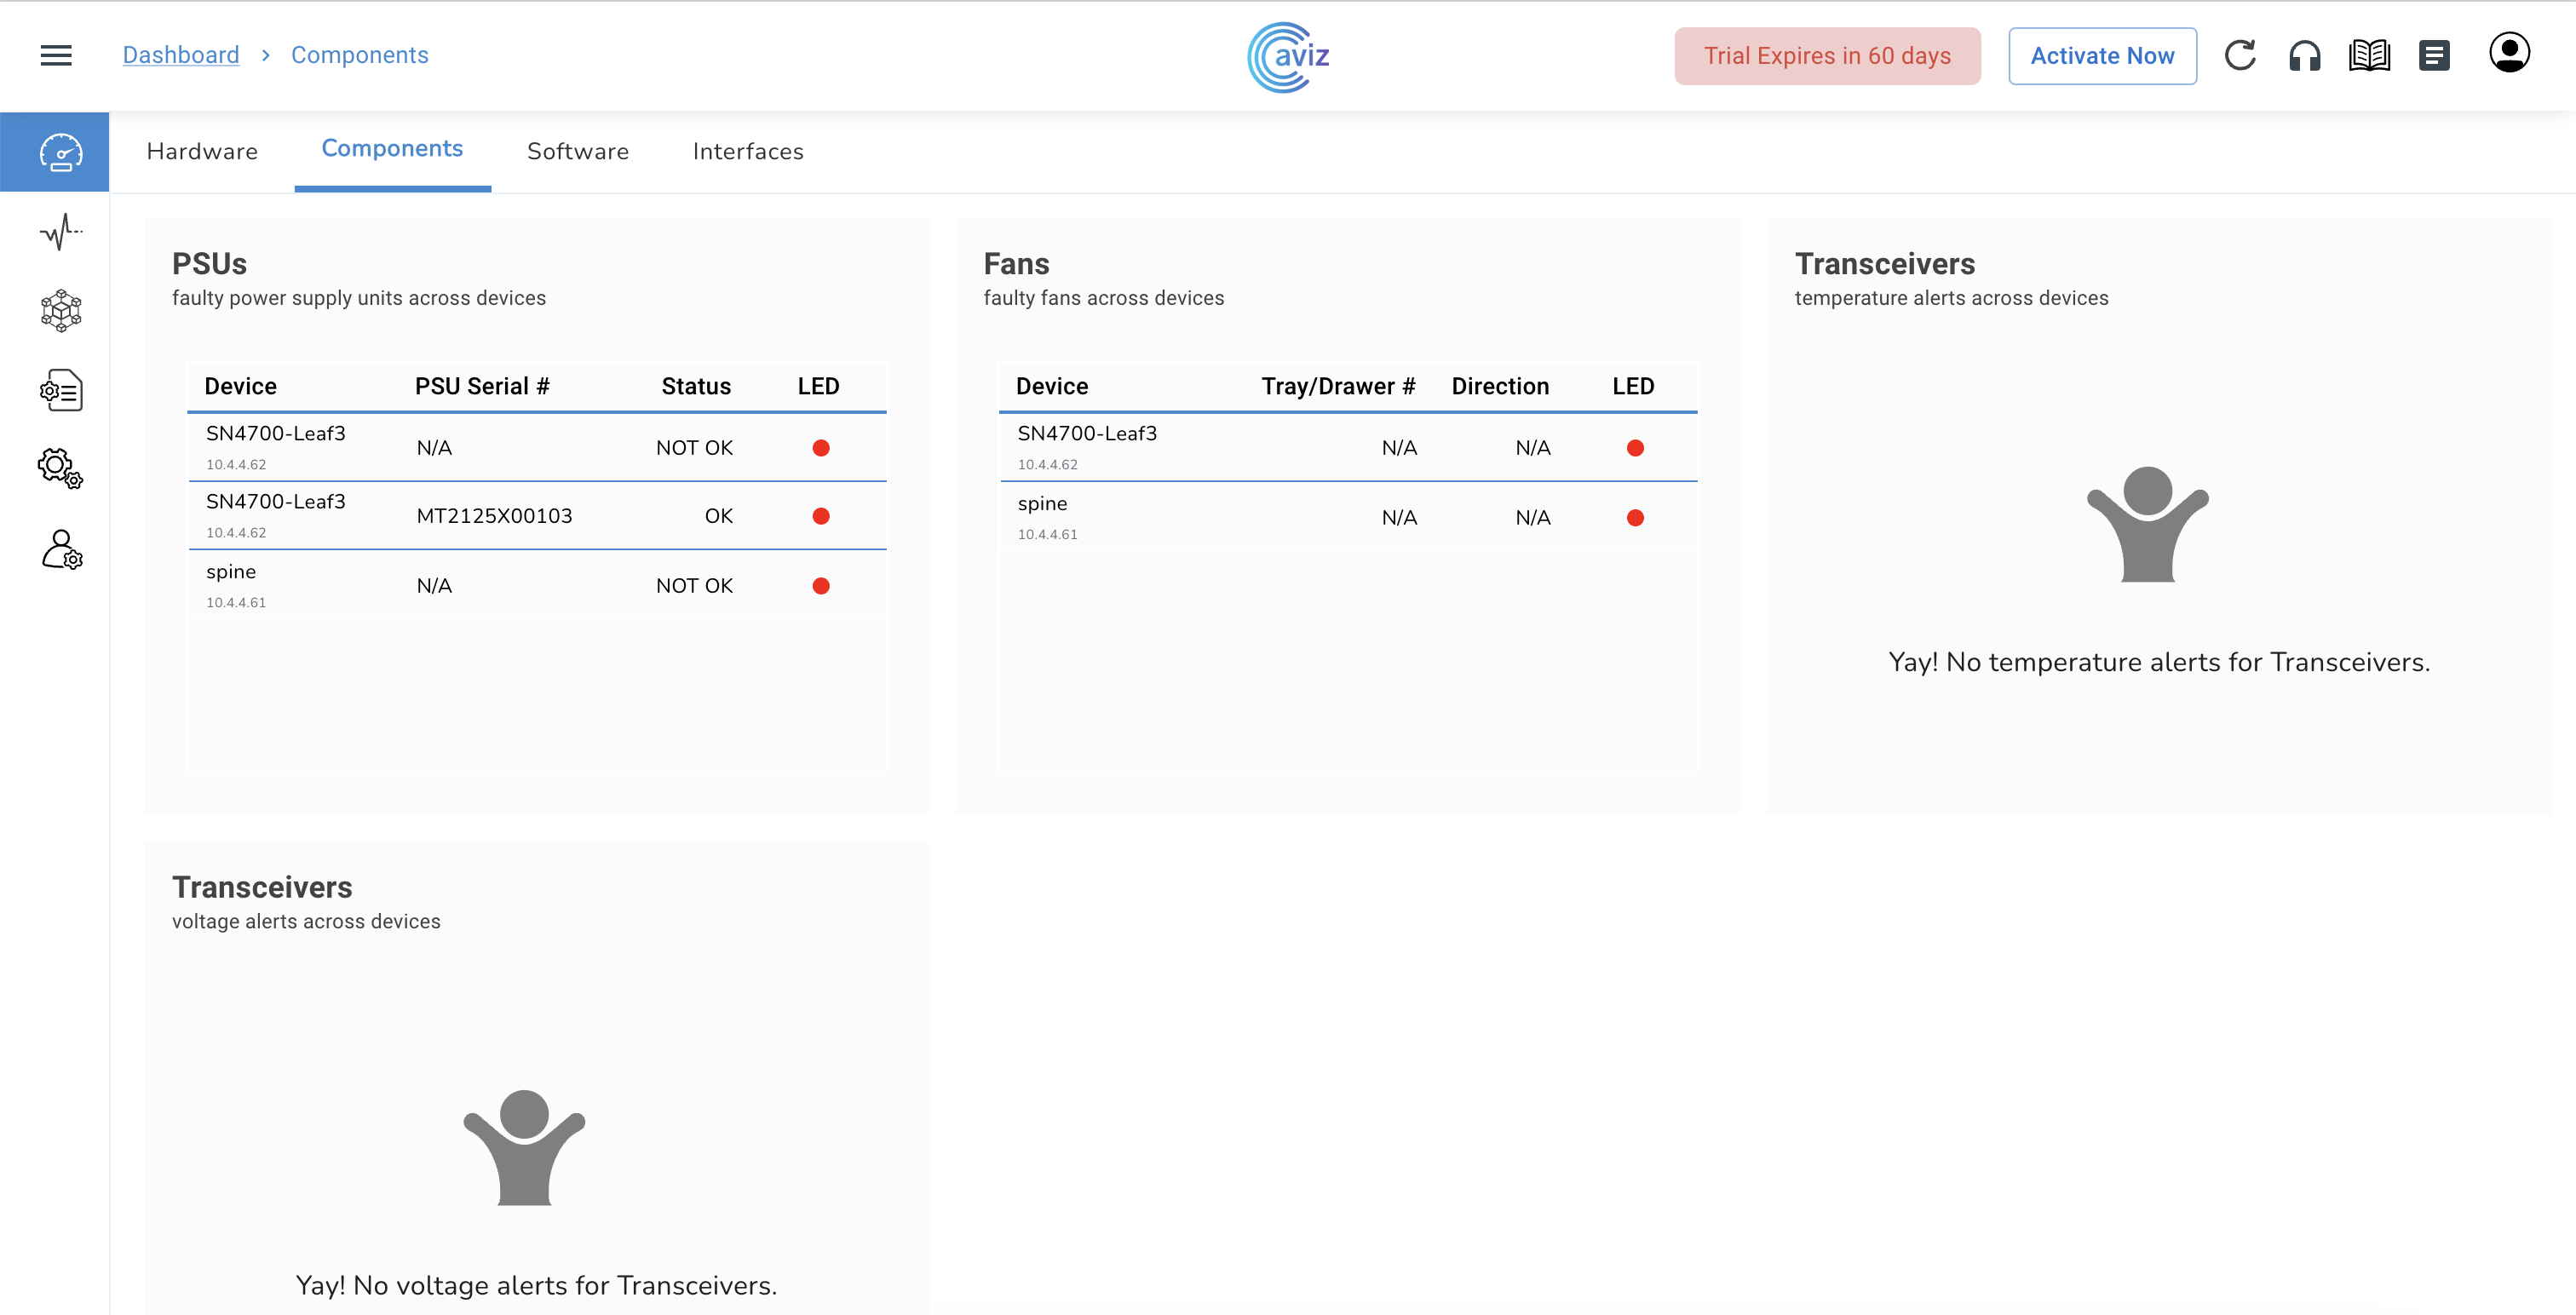
| PSUs | Shows the list of
|
| Fans | Show the list of
|
| Transceivers Temperature | Temperature readings and alerts for Optics |
| Transceivers Voltage | Voltage readings and alerts for Optics |
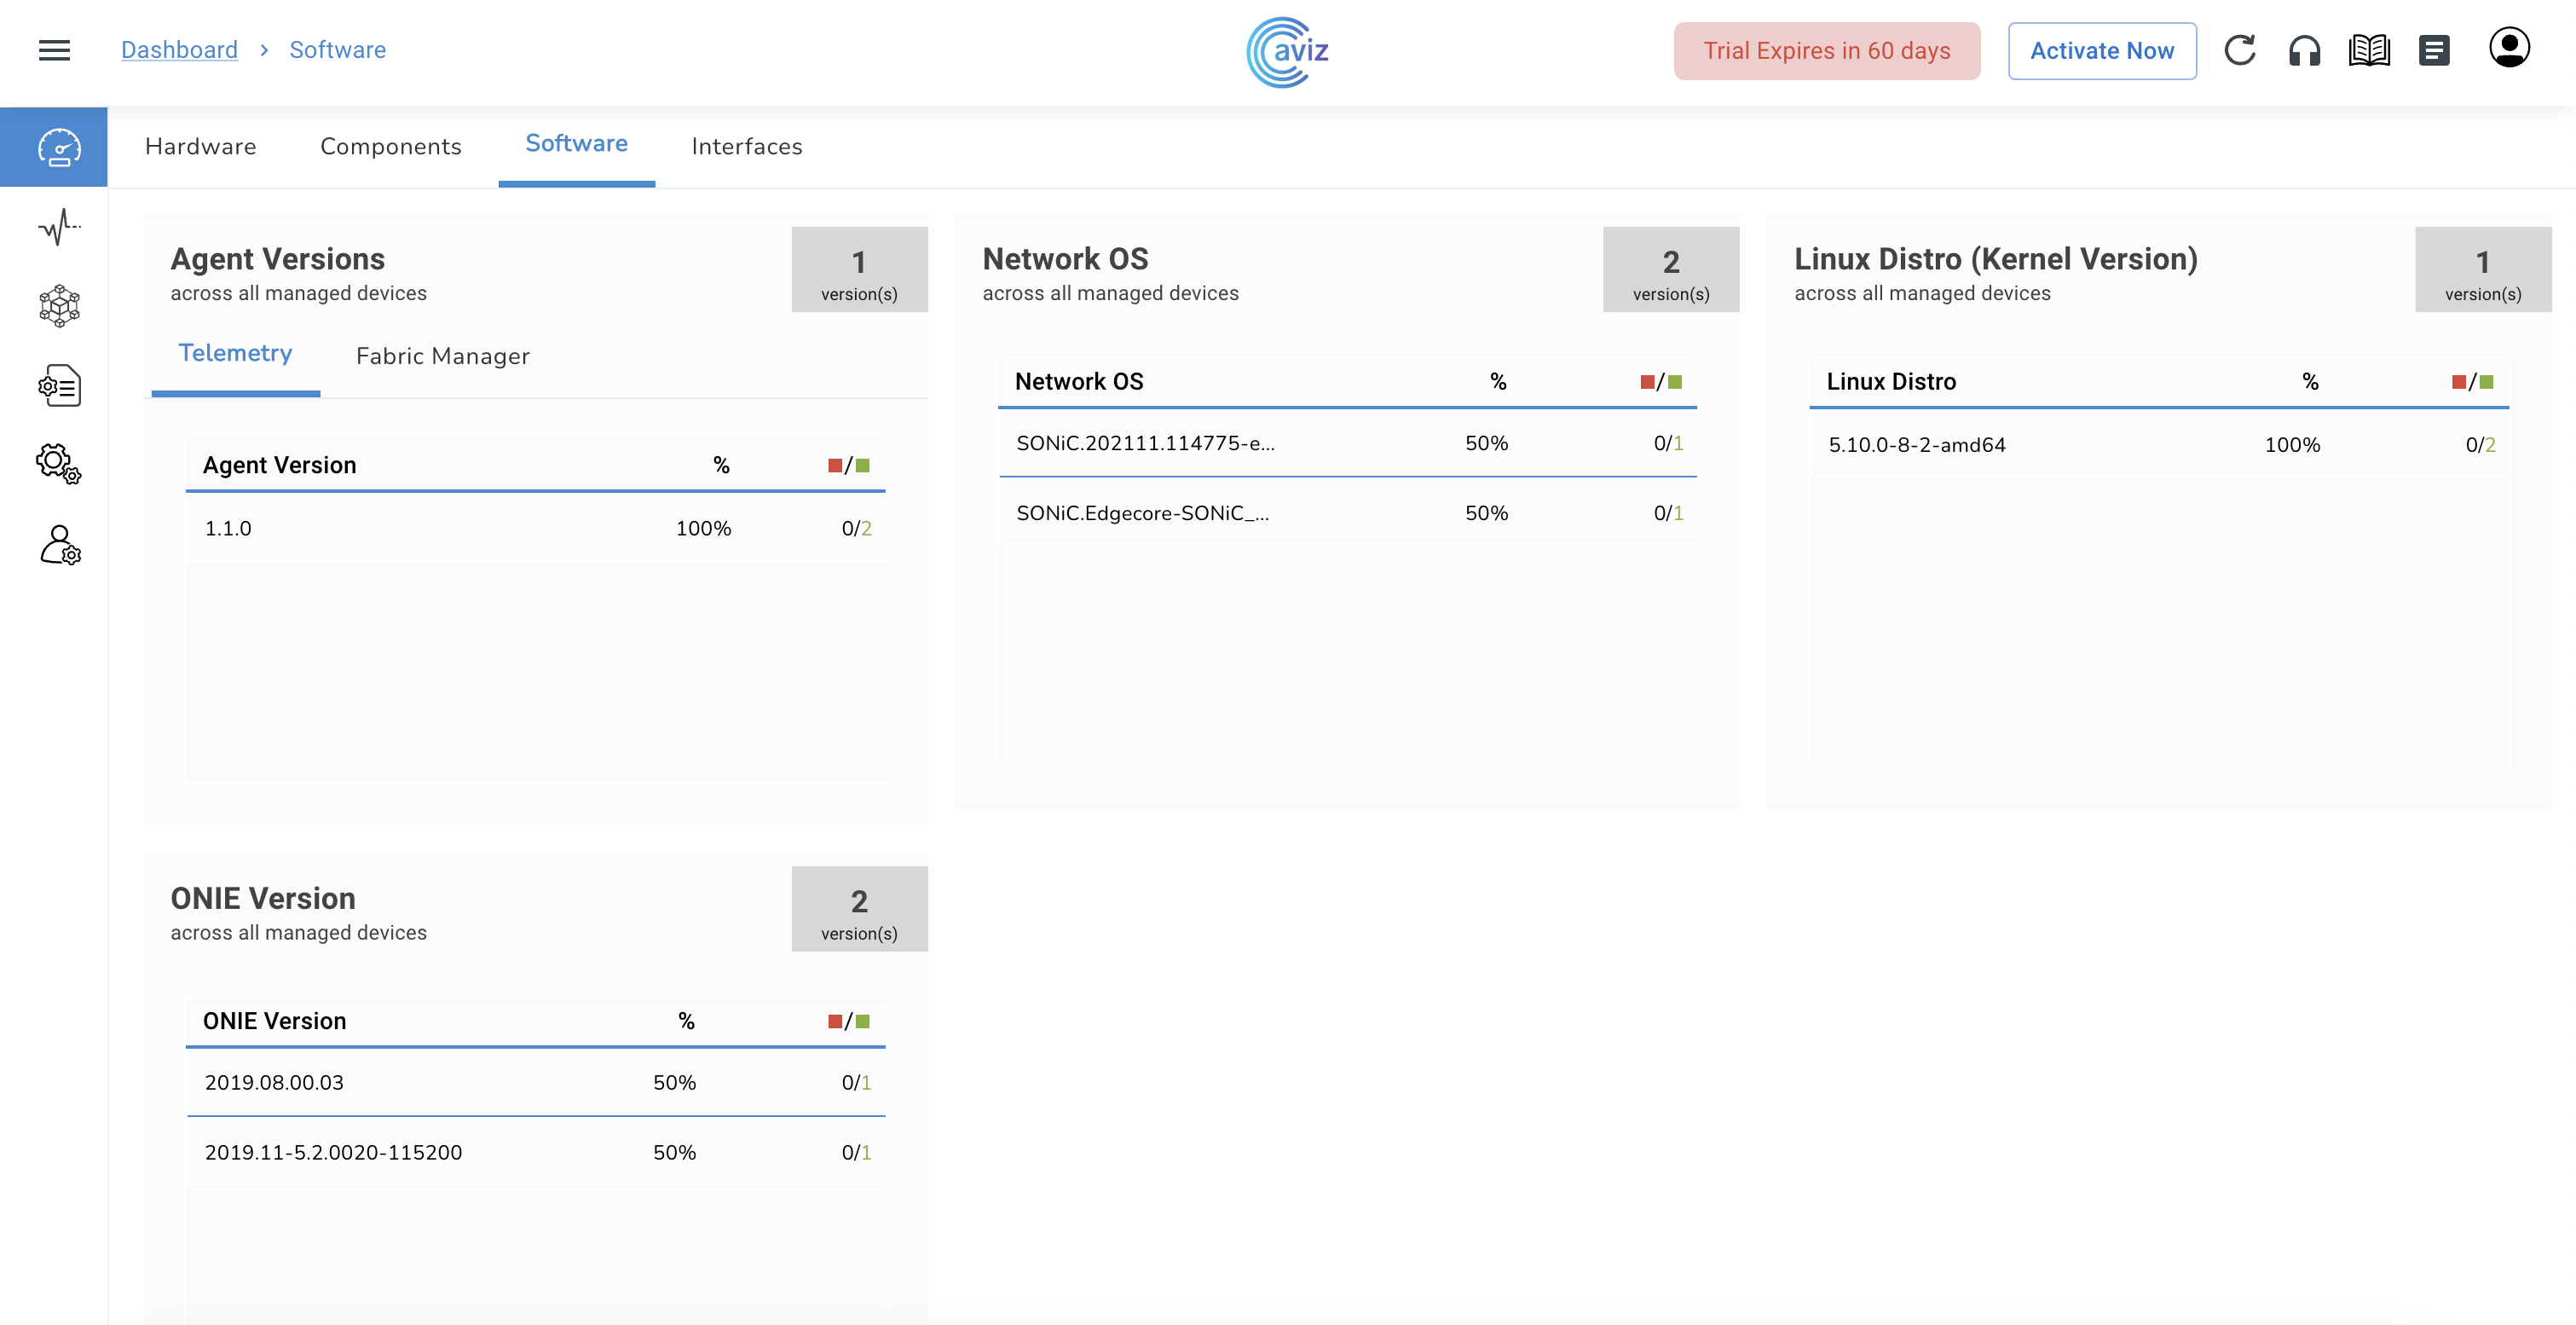
Agent Version Running on all devices
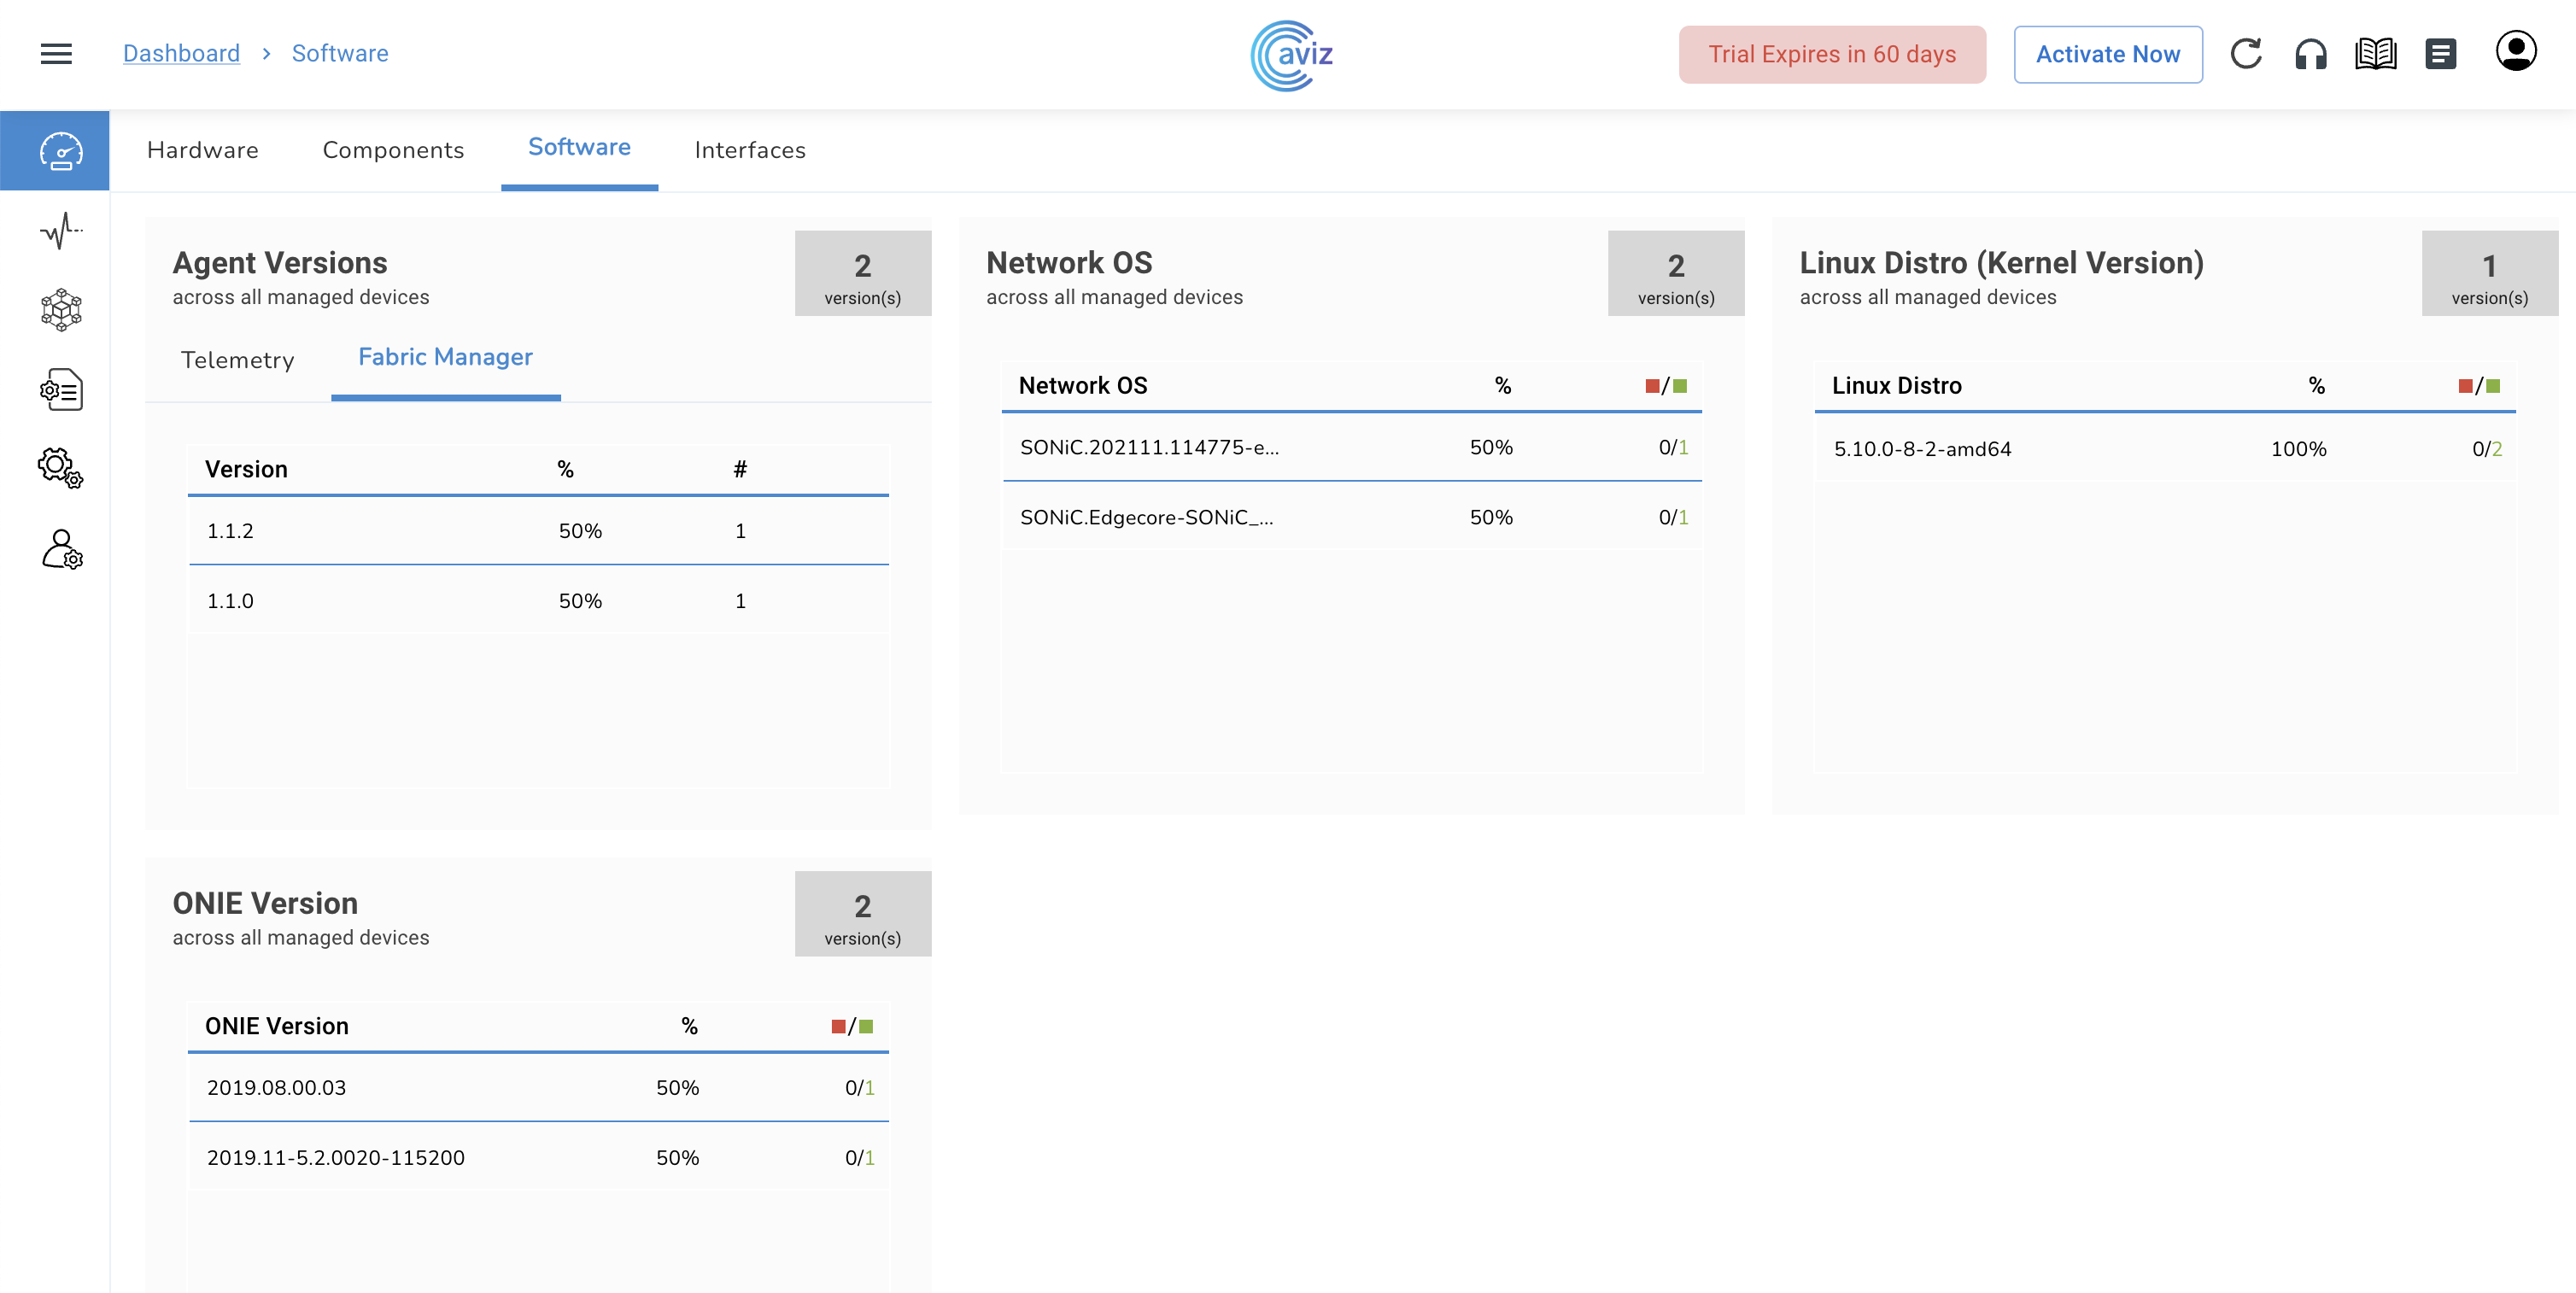
Fabric Manager Version Running on all devices
| Feature | Use |
|---|---|
| Telemetry Agent version |
|
| Orchestrator Agent version |
|
| Network OS |
|
| Linux Distro |
|
| Feature | Use |
|---|---|
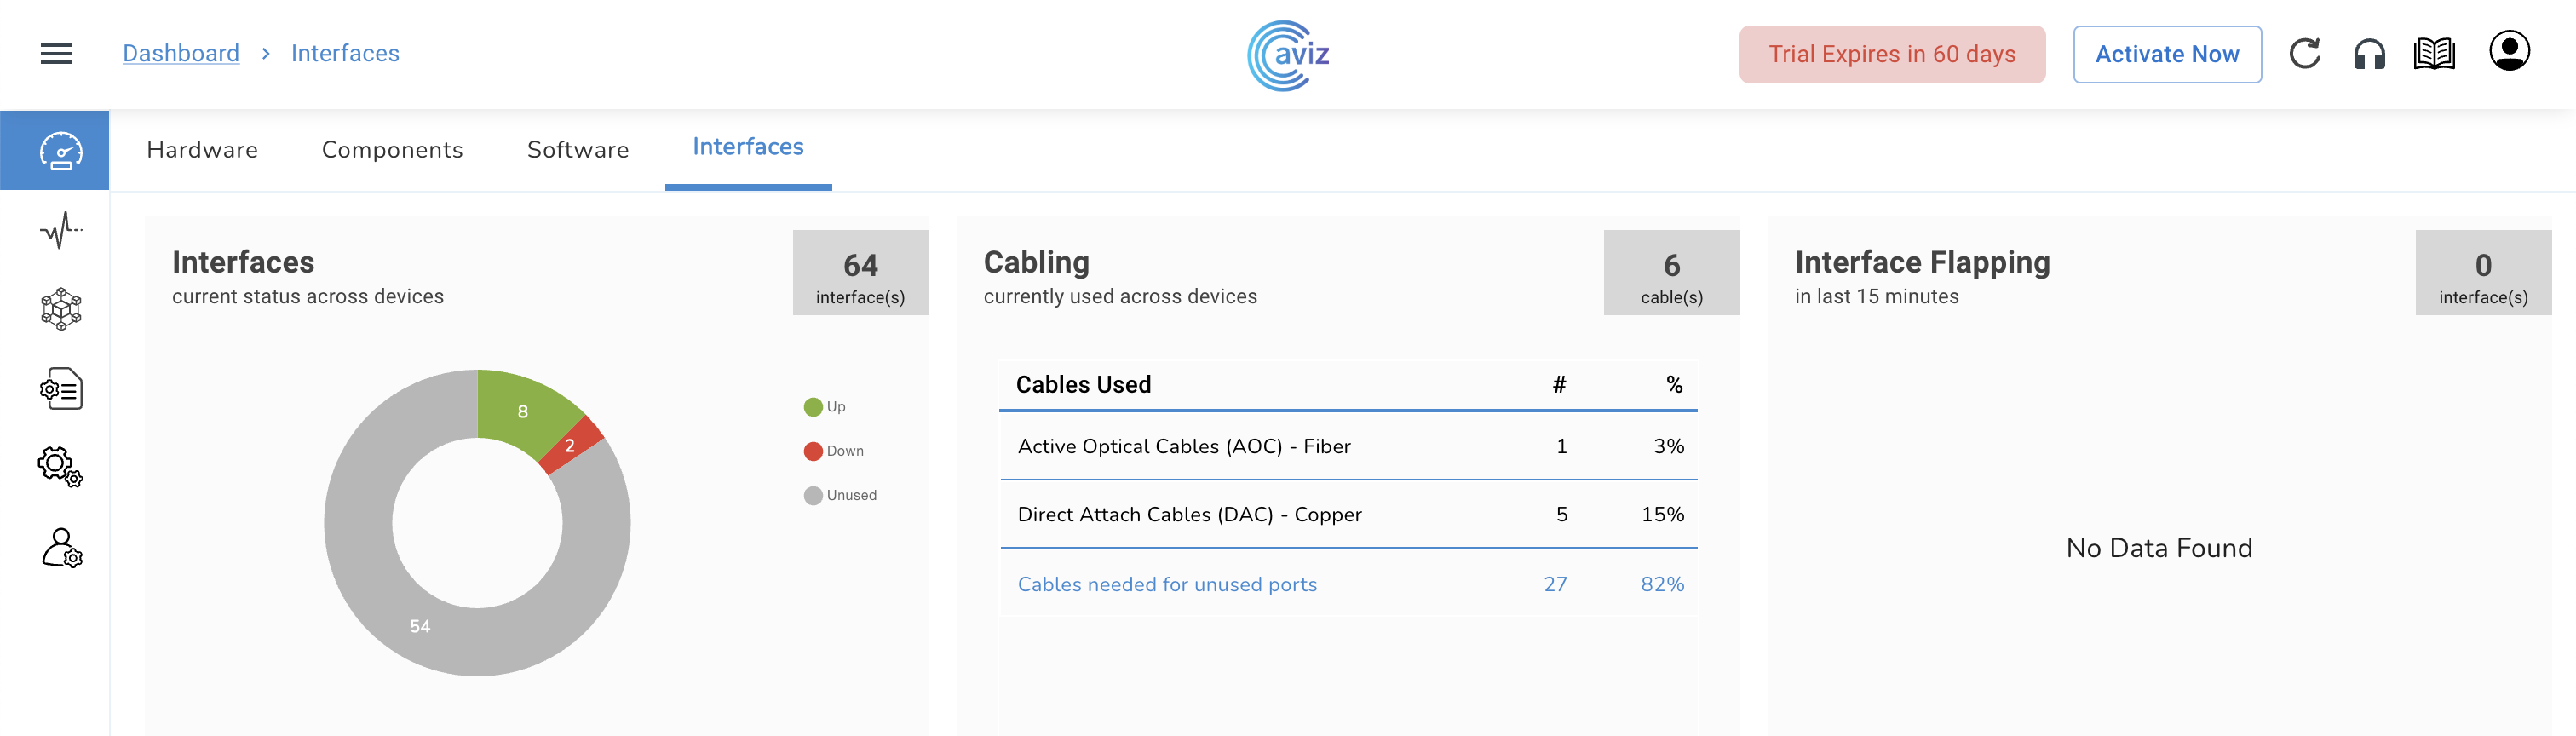
| Interfaces |
|
| Cabling |
|
| Interface Flapping |
|