Viewing the Dashboard
The Dashboard is the default home page of the FlowVision GUI. To return to the dashboard view from any other page, click System > Dashboard.
The Dashboard shows you the following data:
ASN Fabric Information
This pie chart shows you the device information based on the ASN Version and the ASN Location. You can hover the mouse pointer over the charts to display a tooltip with more relevant information.
The following image shows the ASN fabric information charts:
Platform Health
The platform health table shows you the CPU usage, and memory availability for each connected node. From this data, you can infer the overall health of the platform.
The following image shows the platform health table:
Link Information
The link information table displays the total number of ports across all connected nodes, the number of ports enabled with administrative privileges, and the number of ports that are down.
The following image shows the link information table:
Top 5 Ports by Traffic
The top 5 ports by traffic show you the top 5 ports across all connected nodes sorted on the basis of their traffic rate. The table shows you the device, port, Mode, In Pkts & the number of In Discards.
The following image shows the top 5 ports by traffic table:
Syslog Statistics
The SYSLOG Statistics shows you the nodes sorted based on the SYSLOG messages. The table shows the device IP, and the number of SYSLOG messages, filtered by severity.
The following image shows the SYSLOG Statistics:
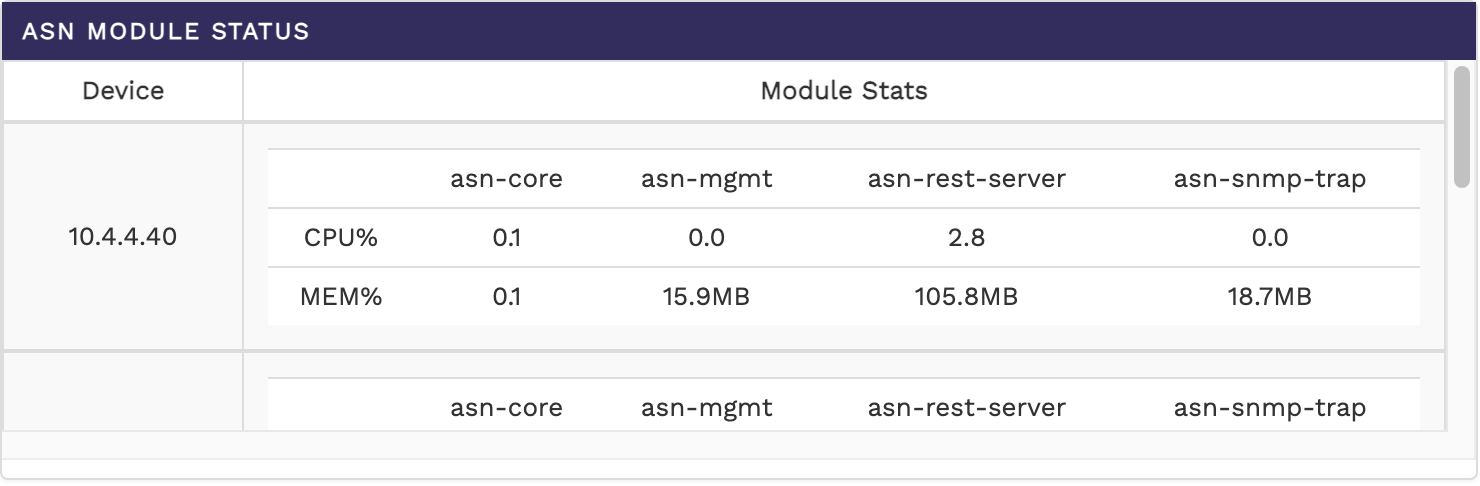
ASN Module Status
The ASN Module Status shows the top nodes and their health with details about the various components of ASN sorted node IP.
The following image shows the ASN Module Status:
HA Status
The HA Status shows the HA status between the connected nodes along with the Cluster Status & Data Export Status.
The following image shows the HA Status: