arrow-left

All pages
gitbookPowered by GitBook
1 of 32

Loading...

Loading...

Loading...

Loading...

Loading...

Loading...

Loading...

Loading...

Loading...

Loading...

Loading...

Loading...

Loading...

Loading...

Loading...

Loading...

Loading...

Loading...

Loading...

Loading...

Loading...

Loading...

Loading...

Loading...

Loading...

Loading...

Loading...

Loading...

Loading...

Loading...

Loading...

Loading...

Managing Users

To manage users from the FlowVision GUI, click System > User Management.

The User Management page shows the details of all the users of the system and their user privileges and roles. From the User Management page, you can add new users, edit user roles and permissions, de-activate a user, and delete a user.

circle-info

You must have admin privileges to add, edit, or delete a user.

The following image shows the User Management page:

hashtag
Adding a New User

To add a new user,

  1. Click the ADD button on the header of the user management table at the top. The New User window displays.

  2. Specify the Email address, Username, Password, and Role of the new user in their respective fields. The Role drop-down field has two options - Admin and Viewer. The Admin role has full access and the Viewer role has read-only access.

hashtag
Editing Existing Users

To edit an existing user,

  1. Click the Edit button against the user in the User Management table. The Edit User window displays.

  2. Edit the required details in the Email, Username, Password, and Role fields.

  3. Click Update User to update the user details.

hashtag
De-Activating or Deleting Users

In the User Management table,

  • Click the De-Activate button to deactivate a user.

  • Click the Delete button to delete a user.

Click Save to create the user.

Tables showing users, roles, and management options

Viewing the Dashboard

The Dashboard is the default home page of the FlowVision GUI. To return to the dashboard view from any other page, click System > Dashboard.

The Dashboard shows you the following data:

hashtag
ASN Fabric Information

This pie chart shows you the device information based on the ASN Version and the ASN Location. You can hover the mouse pointer over the charts to display a tooltip with more relevant information.

The following image shows the ASN fabric information charts:

hashtag
Platform Health

The platform health table shows you the CPU usage, and memory availability for each connected node. From this data, you can infer the overall health of the platform.

The following image shows the platform health table:

hashtag
Link Information

The link information table displays the total number of ports across all connected nodes, the number of ports enabled with administrative privileges, and the number of ports that are down.

The following image shows the link information table:

hashtag
Top 5 Ports by Traffic

The top 5 ports by traffic show you the top 5 ports across all connected nodes sorted on the basis of their traffic rate. The table shows you the device, port, Mode, In Pkts & the number of In Discards.

The following image shows the top 5 ports by traffic table:

hashtag
Syslog Statistics

The SYSLOG Statistics shows you the nodes sorted based on the SYSLOG messages. The table shows the device IP, and the number of SYSLOG messages, filtered by severity.

The following image shows the SYSLOG Statistics:

hashtag
ASN Module Status

The ASN Module Status shows the top nodes and their health with details about the various components of ASN sorted node IP.

The following image shows the ASN Module Status:

HA Status

The HA Status shows the HA status between the connected nodes along with the Cluster Status & Data Export Status.

The following image shows the HA Status:

Pie chart showing the details of fabric based on HWSKU and OS
Table showing the health information
Table showing link information
Table showing top 5 ports by traffic
Table showing SYSLOG Statistics
Table showing ASN Module Status
Table showing HA Status

Performing Backup and Restore

hashtag
Introduction

To perform a backup or restore from the FlowVision GUI, navigate to: System > Backup/Upgrade

The Backups page displays a list of available system backup files with the following details:

  • Backup Filename

  • Date of Backup Creation

  • Backup Status

  • Option to Delete Specific Backup Files

Additionally, this page provides options to: Upgrade the system using a .jar file. Upgrade the database using a local .sql file.

The following image illustrates the Backups page:

hashtag
Creating a New Backup

To create a new backup, click the Create Backup drop-down menu and select Create Backup. This action creates a new backup file, displaying its status in the backup table.

You can also have the option to selectively backup the database or the FlowVision system. To perform this selective backup,

  1. Click Create Backup > Create Backup. The New Backup window displays.

  2. This will take the backup of the DB and Flowvision.

hashtag
Advanced Backup

  1. Click Create Backup > Create Backup (Advanced).

  2. Select the backup you want to create. The available options are - Backup DB and Backup FlowVision. This is a multi-select option where you can choose either or both.

  3. Click Backup to create the selected backup.

hashtag
Restoring from a Backup

After completing a backup, you can find the list of backups in a table format below

Click on the Restore Icon to restore that particular backup (.sql / .jar ).

The New Backup window displays, used need to select Restore DB or Restore FlowVision or select both if both are available, then Click on the Restore button.

After Restore is completed, there will be a pop-up -

circle-info

The user needs to refresh the browser after 1 minute interval.

Note: The user also can download the backup files ( .sql / .jar ) by clicking the Download Icon, it will save the file to the local system.

hashtag
Upgrading FlowVision

You can upgrade the FlowVision system if required. To upgrade,

There are 2 types of upgrade provided

hashtag
Upgrade Flowvision

  1. Click Upgrade System on the top right corner of the Backups page. The Upgrade System window displays.

  2. Select the Upgrade FlowVision checkbox and select .jar file from the local system

  3. Click Upgrade to upgrade the system.

After the Upgrade, there will be a popup that -

circle-info

The user needs to refresh the browser after 1 minute interval.

hashtag
Upgrade DB

  1. Click Upgrade System on the top right corner of the Backups page. The Upgrade System window displays.

  2. Select the Upgrade DB checkbox and select .sql file from the local system

  3. Click Upgrade to upgrade the system.

After the Upgrade, there will be a popup that -

hashtag
Deleting a Backup

To delete a specific backup file, click the icon against the corresponding backup file in the Backups table. Confirm the delete action in the Confirm Delete prompt.

circle-exclamation

Please use a valid flowvision.jar or fv-db.sql file during the upgrade.

Upgrade Flowvision
Upgrade DB (using a local file)

Configuration

The configuration menu helps you perform the following:

  • Configuring Ports

  • Configuring Metadata Attributes

Configuring Ports

To configure ASN ports using the FlowVision GUI, navigate to:

Configuration > Ports.

This page displays:

  • Managed Nodes and their connected ports.

  • A detailed Ports Table showing:

    • Admin Status.

    • Link Status (UP = Green, DOWN = Red).

    • Speed & Mode.

  • Port Modes in ASN:

Cplane (Control Plane): Handles control-plane traffic, such as S11, N4, and N11.

Uplane (User Plane): Manages user-plane traffic, including S1-U and N3.

The following image illustrate the ports page with device, ports, and port status details:

circle-info

Hover over a device or port icon for additional details.

hashtag
Editing Port Properties

To edit the properties of a port,

  1. Click the Edit button against the required port in the ports table. The Port Properties window displays.

  2. Update the above properties as required.

  1. The following properties can be updated -

  • Description: Sets a custom link description

  • Admin Status: Configures the port’s administrative state (Up/Down).

  • GRE Strip: Enables or disables GRE stripping on incoming packets (applicable only to C-plane ports).

  1. Click Save to apply the changes.

triangle-exclamation

Once the port mode has been successfully changed, the ASN Core will automatically restart on the node to apply the updates

Configuring Boot Configuration

To configure Boot Configuration using the FlowVision GUI, navigate to:

Configuration > Boot Configuration.

  • A detailed boot configuration showing:

    • hashtag
      General

    • hashtag
      Features

    • hashtag
      Packet Core Interface

    • hashtag
      Kafka Producer Config

hashtag
General

The following image illustrate the General configs such as hash table, ip & subscriber session limit, Coutn etc as shown below

LB Hash Type:

  • Specifies the method used for load balancing packet flows across processing cores.

  • 3 Tuples: Uses source IP, destination IP, and protocol/port for hashing.

  • 5 Tuples: Uses source IP, destination IP, protocol, source port, and destination port for hashing.

IP Session Limits:

  • Sets the maximum number of concurrent IP sessions per core.

Subscriber Session Limits:

  • Definition: Defines the maximum number of subscriber sessions (unique users/devices) that can be handled simultaneously.

  • The range is typically 100 to 3,000,000. Higher values require more memory and CPU resources.

Kafka Core Count:

  • Definition: Number of CPU cores dedicated to Kafka producer threads for exporting data.

  • Limitation: Must be less than or equal to the number of Packet Processing cores.

KPI Core Count:

  • Definition: Number of CPU cores allocated for Key Performance Indicator (KPI) processing tasks.

  • Limitation: Must be less than or equal to the number of Packet Processing cores.

Start Cores:

  • Definition: Specifies the logical core ID from which packet processing should begin.

  • Limitation: Must be a valid core ID present on the system. Incorrect values may prevent the application from starting.

Total Cores:

  • Definition: Total number of logical CPU cores allocated for packet processing and related tasks.

  • Limitation: Limited by the physical hardware; allocating more cores than available will result in errors.

Packet Processing Cores (Per Port)

  • Definition: Number of CPU cores assigned to process packets for each port.

Total Port

  • Definition: Number of asn ports configured for packet processing.

  • Limited by hardware capabilities and configuration, typically between 1 and 8.

Control Port

  • Definition: Designates the asn port used for control plane traffic.

  • Must select a valid port from available options (e.g., port0, port1)

hashtag
Features & Packet Core Interface

The following image illustrate the Features and Packet core interface configs such as Radius, metadata export,4G & 5G interface type etc.

Enable Radius

  • Definition: Enables or disables support for the RADIUS protocol, used for authentication and accounting.

  • Set to "true" or "false" based on deployment requirements.

Active Bearer Export

  • Definition: Enables the export of active bearer information for monitoring or analytics.

Uplane Flow Stats (Control Metadata):

. Definition: Enables collection and export of user-plane flow statistics as part of control metadata.

Packet Core Interface:

  • Definition: Selects the type of packet core interface for network connectivity.

  • 4G Interfaces: S5-S8, S11

  • 5G Interfaces: N11

hashtag
Kafka Producer Config

The following image illustrate the Kafka Producer configs such as Queue buffer, compression type etc.

Queue Buffer Messages (max):

  • Definition: Maximum number of messages buffered per Kafka queue before sending.

  • Range is 1,000 to 1,000,000,000.

Queue Buffer kbytes (max):

  • Definition: Maximum buffer size in kilobytes per Kafka queue.

  • Range is 1 to 2,147,483,647 kB.

Queue Batch Size (max):

  • Definition: Maximum number of messages sent in a single Kafka batch.

  • Range is 1 to 2,147,483,647.

Linger (ms):

  • Definition: Time in milliseconds to wait before sending a batch to Kafka, allowing more messages to accumulate.

  • Range is 0 to 900,000 ms.

Compression Type:

  • Definition: Compression algorithm used for Kafka messages.

  • Must be one of: none, gzip, lz4, zstd, snappy. Unsupported types will cause errors.

DPI Configuration

Deep Packet Inspection (DPI) is a powerful technique that analyzes network traffic at the packet level, going beyond basic header inspection to examine the payload of the actual data being transmitted.

Aviz Service Nodes support in-service DPI upgrade for enhanced new DPI library integrations.

Configuring Global Parameters
Configuring System Parameters
Configuring Kafka Security
GRE Strip.
  • Port Description.

  • Configuring Metadata Attributes

    The following Metadata Attributes can be modified using this menu:

    • 4G-LTE/5G-NSA

    • 5G-SA

    • U-Plane

    • Radius

    4G-LTE/5G-NSA

    Configurable Metadata Extraction in ASN

    From this page, you can enable or disable the following metadata extraction options on the Aviz Service Node (ASN) for 5G-NSA:

    hashtag
    User Information

    1. IMSI (International Mobile Subscriber Identity): A unique identifier for a mobile subscriber.

    2. IMEI (International Mobile Equipment Identity): A unique identifier for a mobile device.

    3. MSISDN (Mobile Station International Subscriber Directory Number): The phone number associated with the subscriber.

    hashtag
    User Location Information

    1. CGI (Cell Global Identifier): A unique identifier for a cell in a mobile network.

    2. SAI (Service Area Identifier): Identifies the service area within a network.

    3. RAI (Routing Area Identifier): Specifies the routing area within a mobile network.

    hashtag
    Tunnel Information

    1. IPv4 Address Uplink (SGW): The IPv4 address for the uplink from the Serving Gateway (SGW).

    2. IPv4 Address Downlink (eNodeB): The IPv4 address for the downlink to the eNodeB (Evolved Node B).

    3. IPv6 Address Uplink (SGW): The IPv6 address for the uplink from the Serving Gateway (SGW).

    hashtag
    Key Performance Indicator(KPIs)

    1. Cplane Latency: The latency in the control plane, measuring the delay in signaling and control messages.

    2. Per IMSI Metrics:

      • Uplane Bandwidth/Throughput: The bandwidth or throughput in the user plane, specific to each IMSI .

    APN/DNN (Access Point Name / Data Network Name): Defines the network path for data connections.
  • USER TYPE: Classification of the user, typically indicating subscriber type or service level.

  • UE IP ADDR(User Equipment IP Address):The IP address assigned to the user's device.

  • TAI (Tracking Area Identifier): Identifies the tracking area in LTE networks.

  • ECGI (EUTRAN CGI): A unique identifier for cells in LTE networks.

  • LAI (Local Area Identifier): Identifies the local area within a GSM network.

  • Macro eNodeB Field: Information related to the macro eNodeB, a type of base station in LTE networks.

  • Extended Macro eNodeB Field: Additional information for extended macro eNodeB configurations.

  • Cell Changed: Indicates whether the user's device has changed cells within the network.

  • IPv6 Address Downlink (eNodeB): The IPv6 address for the downlink to the eNodeB (Evolved Node B).

  • TEID Uplink (SGW): The Tunnel Endpoint Identifier for the uplink from the Serving Gateway (SGW).

  • TEID Downlink (eNodeB): The Tunnel Endpoint Identifier for the downlink to the eNodeB (Evolved Node B).

  • CONTROL TEID: The Tunnel Endpoint Identifier used for control plane signaling.

  • CONTROL IP: The IP address used for control plane signaling.

  • Radio Access Type (RAT): The type of radio access technology being used (e.g., LTE, 5G).

  • Uplane Latency: The latency in the user plane, measuring the delay in data transmission for each IMSI.

    5G-SA

    Configurable Metadata Extraction in ASN

    From this page, you can enable or disable the following metadata extraction options on the Aviz Service Node (ASN) for 5G-SA:

    hashtag
    User Information

    1. IMSI (International Mobile Subscriber Identity): A unique identifier for a mobile subscriber.

    2. IMEI (International Mobile Equipment Identity): A unique identifier for a mobile device.

    3. MSISDN (Mobile Station International Subscriber Directory Number): The phone number associated with the subscriber.

    hashtag
    User Location Information

    1. CGI (Cell Global Identifier): Unique identifier for a cell in a mobile network.

    2. TAI (Tracking Area Identifier): Identifier for tracking areas in a 5G network.

    3. Cell Changed: Indicates whether the user's device has changed cells within the network.

    hashtag
    Tunnel Information

    1. IPV4 Address Uplink (UPF): IPv4 address for the uplink from the User Plane Function (UPF).

    2. IPv4 Address Downlink (RAN): IPv4 address for the downlink to the Radio Access Network (RAN).

    3. IPv6 Address Uplink (UPF): IPv6 address for the uplink from the User Plane Function (UPF).

    hashtag
    Key Performance Indicator(KPIs)

    1. Cplane Latency: The latency in the control plane, measuring the delay in signaling and control messages.

    2. Per IMSI Metrics:

      • Uplane Bandwidth/Throughput: Bandwidth or throughput in the user plane for each IMSI.

    Configuring Global Parameters

    To view and configure ASN global parameters from the FlowVision GUI, navigate to:

    Configuration > Global.

    The following image illustrates the ASN Global page:

    Global Config Page

    hashtag
    Configure Global Parameters

    Select a Node to configure the below parameters:

    • Kafka Export Interval (seconds): Sets the interval for exporting data to Kafka, configurable between 5 to 300 seconds.

    • 5G Cplane Processing (N4/N11): Choose between N4 or N11 for processing 5G control plane traffic.

    • HTTP2 Port: Define multiple HTTP2 ports, separated by commas (,).

    Configuring Threshold and Timeout

    The Control Session Timeout Support feature enables automatic handling of inactive control-plane sessions by detecting and cleaning up sessions that exceed a defined period of inactivity.

    To configure and manage control session timeout and active communication bandwidth of ASN via the FlowVision GUI, navigate to:

    Configuration > ASN > Threshold and Timeout

    Threshold and Timeout Configuration Options:

    1. control session timeout

    2. Selecting the control session timeout, you can configure both value by H:M.

    3. KPI Active communication: configure threshold bytes and interval time

    Below image show control session timeout and active communication configuration

    APN/DNN (Access Point Name / Data Network Name): Defines the network path for data connections.
  • USER TYPE: Classification of the user, typically indicating subscriber type or service level.

  • 5G-SA TYPE: Type of 5G network architecture, such as standalone (SA) or non-standalone (NSA).

  • UE IP ADDR(User Equipment IP Address):The IP address assigned to the user's device.

  • IPv6 Address Downlink (RAN): IPv6 address for the downlink to the Radio Access Network (RAN).

  • TEID Uplink (UPF): Tunnel Endpoint Identifier for the uplink from the User Plane Function (UPF).

  • TEID Downlink (RAN): Tunnel Endpoint Identifier for the downlink to the Radio Access Network (RAN).

  • RAT (Radio Access Type): The type of radio access technology used, such as 5G NR.

  • Uplane Latency: Latency in the user plane, measuring data transmission delay for each IMSI.

    GRE Offset Strip Length: Specifies the length of the GRE header to strip from ingress packets.

  • Application Identification: Enable or disable application identification.

  • Metadata Export: Enable or disable data export to Kafka.

  • Kafka Export Attributes

    The list below specifies the unique unified data type of metadata attributes exported from ASN, 5GC-control-session-data-mapping, EPC-control-session-data-mapping, and the user-session-data-mapping file.

    • 5GC-control-session-data-mappingarrow-up-right

    • EPC-control-session-data-mappingarrow-up-right

    • SIP-session-data-mapping

    • Radius-session-data-mapping

    User-session-data-mappingarrow-up-right

    Configuring Deduplication

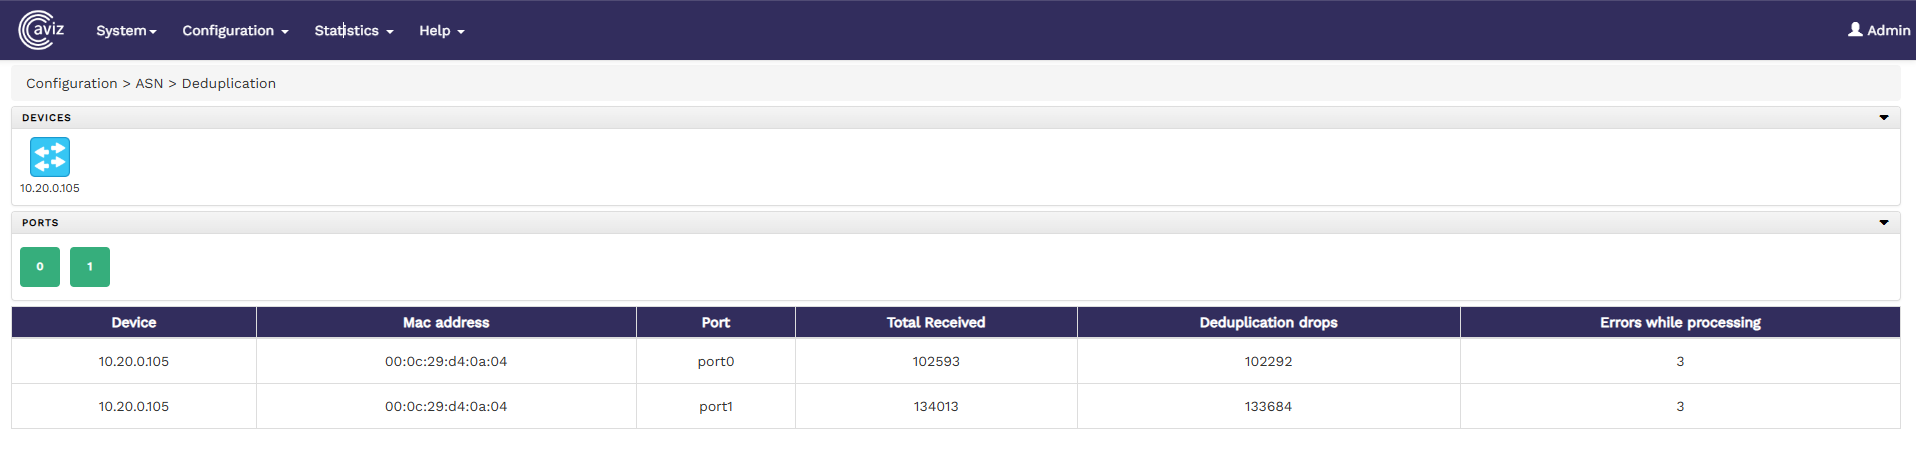
    Packet deduplication is a feature used to identify and eliminate duplicate network packets, improving network efficiency and reducing redundant data processing. It works by comparing incoming packets

    To configure and manage packet deduplication of ASN via the FlowVision GUI, navigate to:

    Configuration > ASN > Deduplication

    Deduplication Configuration Options:

    1. Packet Deduplication: Toggle this option to enable/disable deduplication.

    2. Selecting the Packet Source, you can choose one of the following packet sources:

      1. Full Packet: Deduplication is applied to the entire packet.

      2. Routed Packet: In real time, the packets can be routed across multiple devices/hops. Hence there are chances the duplicate packets can be received to monitoring fabric with different Src MAC/TTL/Checksum fields.

    3. Anchor : Determines the starting position for packet comparison during deduplication. Available options:

      1. Packet Start – Begins deduplication from the start of the packet.

      2. L3 Start – Uses the Layer 3 (network layer) header as the reference point.

    4. Offset: Define the byte offset from the anchor point where deduplication begins till the provided bytes (14 to 128 bytes)

    5. Window Size: The time interval within which duplicate packets will be identified. Available options: 2,4,6 & 8ms.

    6. Deduplication Interface: Select the network interface where deduplication should be applied.

    Below image show packet deduplication for full packet

    Below image show the Packet Deduplication for Routed Packet

    When the Routed Packet option is selected, users can exclude the following fields from packet deduplication:

    • Ignore IPv4 TTL: Ignores changes in the TTL (Time-To-Live) field for IPv4 packets.

    • Ignore L2 Header: Excludes Layer 2 (Ethernet) header fields from deduplication.

    • Ignore IPv4 Checksum: Ignores differences in IPv4 checksums when comparing packets.

    circle-info
    • Packet drop for a few milliseconds is expected during configuration changes as the deduplication module reinitializes.

    • The deduplication feature operates in DC mode.

    L4 Start – Anchors deduplication at the Layer 4 (transport layer) header.
  • L4 Payload – Focuses on the Layer 4 payload for identifying duplicates.

  • The maximum supported speed per port is 50Gbps.

    Configuring Kafka Security

    To configure Kafka Security settings in the FlowVision GUI, navigate to:

    Configuration > Kafka Security

    This page allows you to modify Kafka security protocols and their configurations.

    hashtag
    SASL Support:

    Configure SASL authentication by providing:

    • Username

    • Password

    • Click Save to apply the changes.

    hashtag
    TLS Support:

    To enable TLS security, upload the required files:

    • CA File

    • Certificate File

    • Key File

    Below image illustate TLS configuration page

    circle-info
    • Ensure the correct CA, Certificate, and Key files are uploaded.

    • Only .pem format files are supported.

    hashtag
    No Security Mode:

    If you don't want to configure SASL or TLS security, select "None" here to disable Kafka security.

    If a user changes the configuration but clicks Cancel instead of Submit, the system reverts to the previous settings automatically.

    triangle-exclamation

    Only an Admin can configure or modify Kafka security settings.

    Configuring Packet Capture

    The Packet Capture feature allows users to capture network traffic on selected interfaces for analysis. It provides configurable options to define capture duration, file size limits, & interface.

    Accessing Packet Capture

    1. Navigate to Configuration > ASN > Packet Capture.

    2. Select the device for which you want to capture packets.

    3. Configure the capture settings as needed.

    hashtag
    Packet Capture Options

    • Capture Duration (ms): Specifies the duration in milliseconds for which packet capture will run. The value can range from 1 to 10,000 ms..

    • Capture File Size Limit (MB): Defines the maximum file size for the captured packets before it stops capturing. The value can range from 1 to 1,000 MB.

    • Capture Interface Config: Allows selecting the interfaces (ports) from which packets will be captured, supporting both received (RX) and transmitted (TX) traffic.

    hashtag
    Starting Packet Capture

    1. Configure the desired settings.

    2. Click the Start Packet Capture button to begin capturing network traffic.

    Below image show the Packet Deduplication for Full Packet

    circle-exclamation
    • Packet capture will stop on all configured ports if the cumulative file size or capture duration limit is reached on any port.

    • Captured PCAP files are stored in the ASN server at /var/log/ and can be transferred using the Linux SCP command.

    Viewing Kafka Export Statistics

    To view the Kafka Export statistics of a Node from the FlowVision GUI, click Statistics > ASN>Kafka Export

    hashtag
    The following image shows the Kafka Export Statistics page:

    Kafka Export Statistics

    The page shows the following metrics:

    • C-Plane Data: Indicates the total number of C-Plane data export Counts from ASN Node.

    • Priority C-Plane Data: Indicates the total number of Priority C-Plane data export Count from ASN Node.

    • U-Plane Data: Indicates the total number of U-Plane data export Count from ASN Node.

    • Priority U-Plane Data: Indicates the total number of Priority U-Plane data export Count from ASN Node

    Password
    SASL Configuration
    TLS Configuration
  • RX/TX File Name: Defines the filenames for received (RX) and transmitted (TX) packets.

  • Clean Up Old PCAP File: When enabled, previously stored PCAP files will be deleted before capturing new data.

  • Packet Capture

    Help

    The help page takes you to the REST API documentation. To get to the REST API from the FlowVision GUI, click Help > REST API.

    This action takes you to the Swagger UI page with the FlowVision REST API.

    Swagger UI showing the FlowVision Rest API

    Viewing System Log

    To view the system log from the FlowVision GUI, click System > Syslog.

    FlowVision System Log

    The Syslog page shows the system logs of all the nodes that are online. You can click the device icon for each of the online devices to get the system log for that particular device. The system log shows the device IP, component, severity level, time stamp, and the severity level message with more specific information.

    The following image shows the system log table of a device:

    Table showing system log of a device

    You can change the severity level of the messages displayed in the syslog table using the Severity Level drop-down menu. The available options are Debug, Info, Notice, Warning, Err, Critical, Alert, and Emergency. This is a multi-select menu where you can select multiple severity levels to be displayed.

    Accessing System and Device Information

    To access the system and device information, click System > General.

    FlowVision Geneal Page

    hashtag
    System Information

    The system information table shows you the product name, version, and technical support information about the system.

    The following image shows you the system information tab:

    hashtag
    Devices Information

    The Devices Information table shows detailed information and properties of each connected ASN node. For each ASN node, the table shows the IP address, the MAC address, the Name of the device, the Version, the location, the Ubuntu version of the service, uptime, and the options to edit them.

    hashtag
    Editing Device Properties

    You can edit device properties from the Devices Information table:

    1. Click the Edit button corresponding to the required node on the Devices Information table. The Device Properties window displays.

    2. Change the required node property value in the editable fields. Currently, you can edit the Name and Location.

    3. Click Save to apply your changes.

    Table displaying system information
    Table displaying devices information

    Managing Devices

    To manage connected nodes from the FlowVision GUI, click System > Devices.

    FlowVision Devices

    The Devices screen shows all the connected nodes and their connection status. The nodes that are online are shown with a green status and the nodes that are offline are shown in a red status.

    You can click the icon to reboot an active ASN appliance, restart the ASN application, or remove the ASN database configuration, as shown below.

    ASN Reboot page

    circle-exclamation
    • To delete a device, click the icon.

    • ASN configurations are automatically saved to the database at regular intervals; however, you can use the icon to save the configuration explicitly.

    The following image shows the Nodes page:

    hashtag
    Adding New Devices

    To add a new device,

    1. Click the icon at the top right corner of the Devices page. The Add New Device window displays.

      • Default Credentials:

        • Username: admin

    Password: admin

  • Specify the values for IP Address, Username, and Password in their respective fields.

  • Click Save to apply your changes and add the device. Click Discard to discard your changes.

  • Devices screen showing connected devices

    Managing License

    To configure the Licenses for ASN Nodes from the FlowVision GUI, click System > Licence

    This page displays the current license details in a table format along with Node IP, MAC Address & Serial Number allowing you to either add a new license key for a new ASN device or update an existing license.

    • The following license details are shown for each ASN device:

      • Subscriber License Key, Type & Status

      • Application License Key, Type & Status

    hashtag
    Adding or Updating a License

    To add or modify the license for an ASN node, follow these steps:

    1. Click on the Edit button on the license table next to the respective Node

    2. A popup window will appear with the following fields:

      1. Subscriber License Key

    circle-info

    hashtag
    Please reach out to for License Key

    hashtag
    Information Icon

    In the License Information Table, the Subscriber License Key and Application License Keycolumns include an information icon

    • When hovering over the info icon, detailed license information will be displayed, including:

      • License Type

      • License Status

    Managing Signature

    hashtag
    Introduction

    ASN DPI (Deep Packet Inspection) identifies applications using pattern-based signatures. Aviz Networks provides seamless signature updates, allowing support for new applications or enhancements of existing ones without impacting the existing deployment.

    circle-exclamation

    During the ASN DPI upgrade, there will be a momentary traffic drop.

    hashtag
    Upgrade Process

    Follow these steps to upgrade ASN DPI without restarting ASN modules:

    1. Copy the Signature File to the ASN Device

    2. Extract the Tar file

    3. Navigate to the Installation Directory

    4. Execute the Upgrade Script

    circle-info

    asn-dpi*.tar.gz in this * means unique file Release Number/Name corresponding to the update.

    Viewing Audit Logs

    To view the audit logs from the FlowVision GUI, click System > Audit Logs.

    The audit logs table gives you the details of all the actions performed on the connected systems. The details include the action performed, the date, the IP address of the system used to login to the GUI, the resource used, the username of the operator that acted, and the status of the action.

    The following image shows the audit logs table:

    Audit Logs table showing the actions performed on the systems

    System

    The System menu lets you perform the following actions:

    • Viewing the Dashboard

    • Accessing the General System and Device Information

    Configuring Systems Parameters

    To configure and manage system attributes of ASN via the FlowVision GUI, navigate to:

    Configuration > Systems.

    The Systems Manager page displays the configurations for Kafka, SNMP, NTP, and Syslog servers, allowing users to add or remove associated IP addresses as needed.

    The following image shows the System Parameters page:

    Flow Manager

    hashtag
    Kafka Configurations

    Configure and manage up to one Kafka server IP address for exporting metadata extracted by the Service Node.

    hashtag
    SNMP Trap Configuration

    Configure and manage up to three SNMP trap server IP addresses for receiving SNMP traps generated by the Service Node.

    hashtag
    NTP Configuration

    Configure and manage up to three NTP server IP addresses for time synchronization.

    hashtag
    Syslog Configuration

    Configure and manage up to three Syslog server IP addresses for receiving system logs from the Service Node.

    hashtag
    SNMP Trap Threshold

    Set thresholds for SNMP traps based on the following parameters:

    • Disk Usage (%): Define a trigger when disk utilization exceeds a specified percentage.

    • CPU Usage (%): Set a threshold for CPU utilization percentage.

    • Temperature (℃): Configure the ASN appliance temperature limit before an SNMP trap is triggered.

    Aviz Service Node Graphical User Interface Guide

    hashtag
    Introduction

    This guide explains how to use the FlowVision Graphical User Interface (GUI) to manage ASN servers efficiently.

    The FlowVision GUI provides the following top-level menu options:

    circle-exclamation

    FlowVision uses TCP port 443 for its Web-GUI and TCP port 8091 for communication with the ASN appliance.

    The following image shows the home page of the Aviz FlowVision GUI:

    Managing Devices
    Viewing System Log
    Managing Users
    Managing License
    Performing Backup and Restore
    Viewing Audit Logs
    scp asn-dpi-*.tar.gz <ASN_DEVICE>
    tar xzvf asn-dpi-v1-(Name).tar.gz
     cd asn-dpi-install/
    sudo ./upgrade_dpi.sh
    Application License Key
  • Replace these fields with valid License values

  • After making the changes, click the Save button to apply the new license key

  • Aviz Support
    License page
    Update License Key
    License Info
    Memory Usage (%): Specify the threshold for memory consumption.
  • FAN RPM (%): Set a limit for fan speed in Revolutions Per Minute (RPM).

  • System
    Configuration
    Statistics
    Help
    Aviz FlowVision Home Page

    Viewing Ports Statistics

    To view the port statistics of the connected devices from the FlowVision GUI, click Statistics >ASN> Ports.

    The Ports statistics page shows you the connected Nodes, the available ports on each Node, and the counters. By default, when you select a device the statistics for all the ports in the device are displayed. If you want to get the statistics of a particular port, select the port from the list of ports.

    The following image shows the ASN port statistics page:

    Port statistics page

    hashtag
    CPLANE

    • Port: The name of the port.

    • Rx Packets: The number of received packets.

    • Rx Drop: The percentage of packets dropped.

    hashtag
    UPLANE

    • Port: The name of the port.

    • Rx Packets: The number of received packets.

    • Rx Drops: The percentage of received packets dropped.

    Viewing Global Statistics

    To view the Global statistics of a Node from the FlowVision GUI, click Statistics > ASN>Global.

    hashtag
    The following image shows the global statistics page:

    Global statistics page

    The page shows the following metrics:

    • Total User Sessions: Indicates the total number of active user sessions on the Service Node.

    • Total Subscriber: Reflects the total subscribers registered on the service node.

    Viewing Deduplication Statistics

    Deduplication statistics provide insights into the number of duplicate packets identified and dropped. This helps in optimizing network traffic by ensuring only unique packets are process

    To view the statistics of a Node from the FlowVision GUI, click Statistics > ASN>Kafka Export

    To view the deduplication statistics:

    1. Navigate to Configuration > ASN > Deduplication.

    Troubleshooting

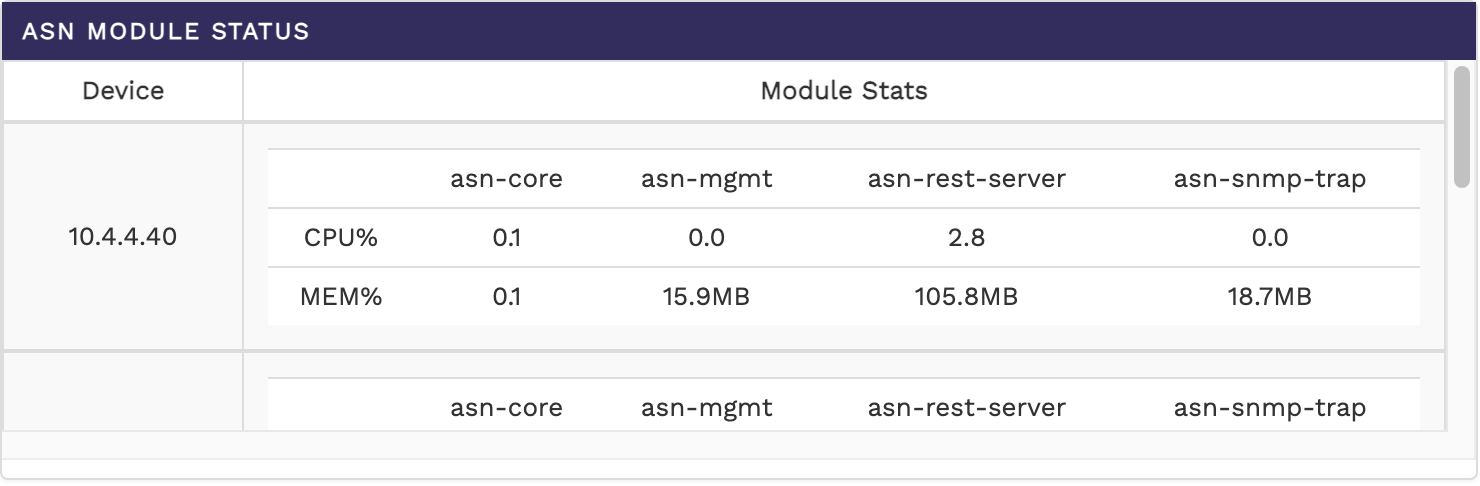
    To check the ASN module status in the Server directly, use the below commands:

    xxx@metasrv01:~/Code/Beta/Package/metadata-appliance$ asncli

    asncli#
      collect-tech-support  Collect the tech support info and Create tar file
      exit                  Exit from the Current Prompt
      quit                  Quit to Enter Native Linux Shell
      show                  Show Commands
    
    
    asncli# show
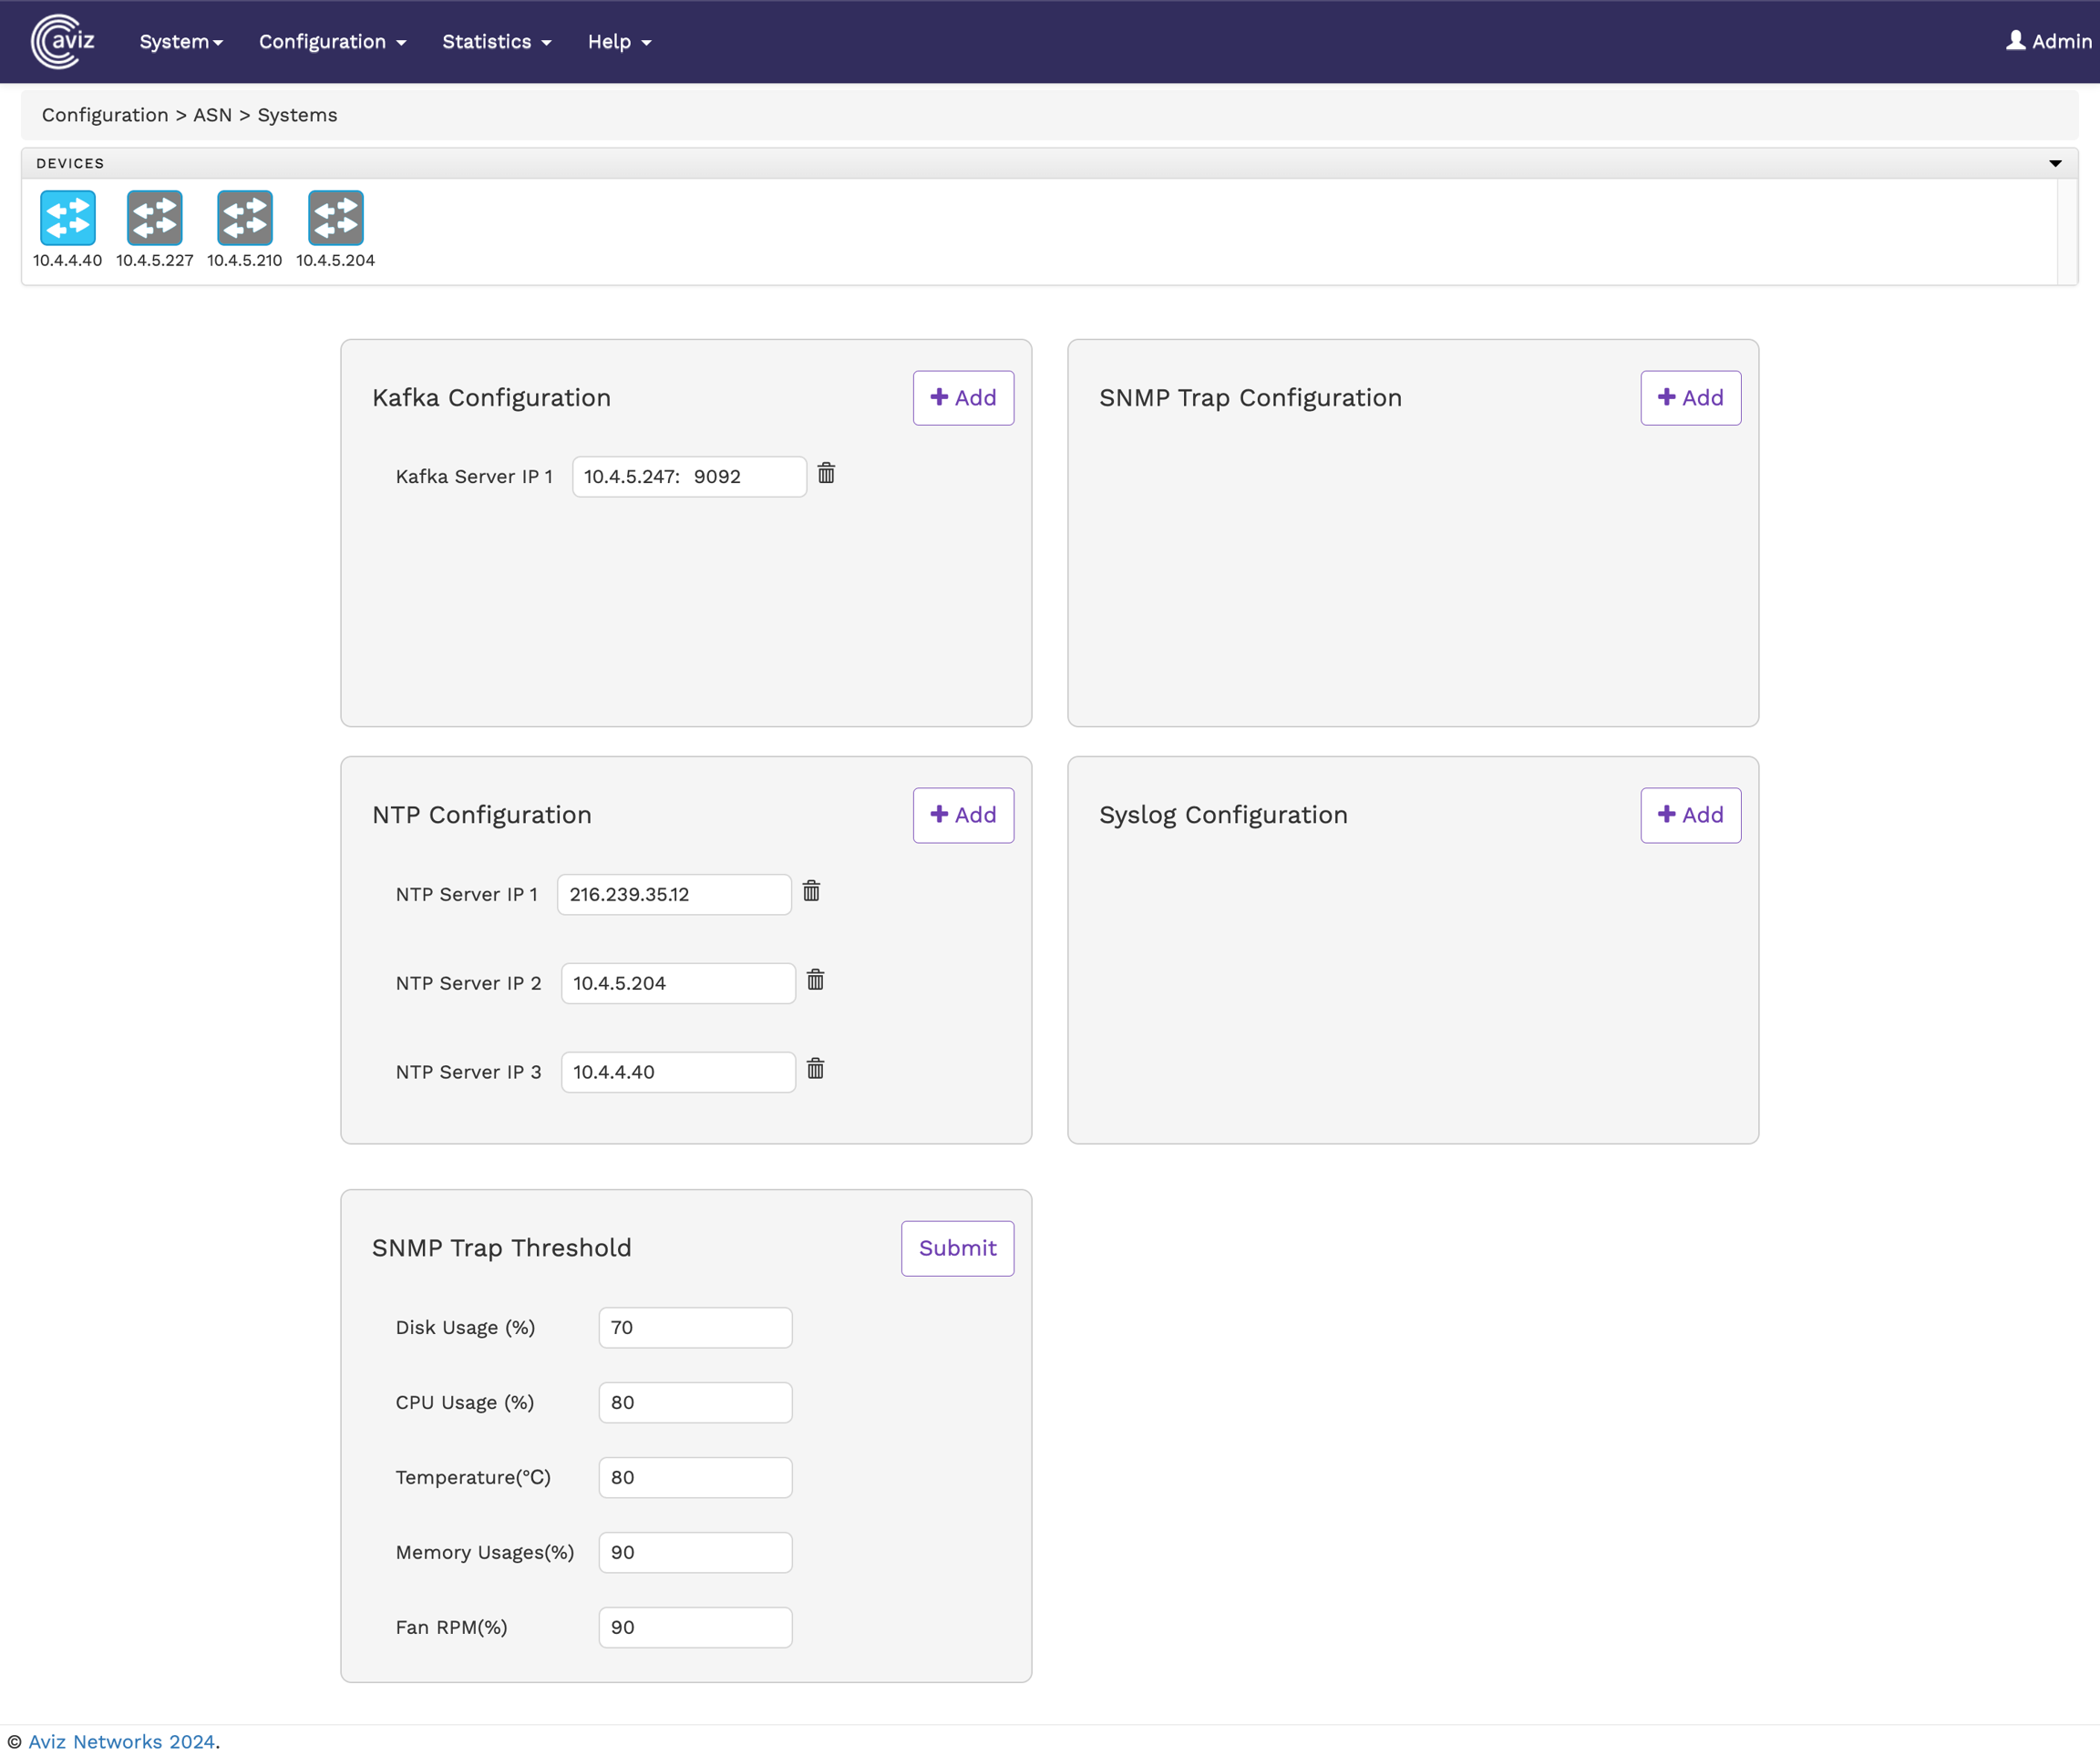
      kafka-config          ASN Kafka Config
      module                ASN Modules
      version               ASN Version
    
    asncli# show kafka-config
    ==================================================================
    ASN Kafka Config
    ==================================================================
    Kafka Export Status : on
    Kafka Server List   : 10.4.5.227:9092
    Kafka Interval Time : 30
    asncli#
    
    asncli# show module status
    Calculating ASN Module Status
    ==================================================================
    Module               Status          CPU %           MEM %
    ==================================================================
    asn-rest-server      active          0.5             40.5MB
    asn-mgmt             active          0.1             15.4MB
    asn-core             active          17.2%           14.7GB
    asn-snmp-trap        active          0.0             18.1MB
    asncli#
    
    asncli# show  version
    ASN-V2.0-20250313
    asncli#

    You can use the below command to collect-tech-support data

    asncli# collect-tech-support
    ASN Techsupport Collection Started
    Tech Support Collection Success - /etc/log_asn/asn_techsupport_20240725_025100.tgz
    asncli#
    GRE Decap: The number of GRE packets decapsulated.
  • N11 Packets Processed: The number of N11 packets received.

  • N4 packets Processed: The number of N4 packets received.

  • S11 Packets processed: The number of S1-U packets received.

  • Decap Drops: The number of packets dropped due to decapsulation error.

  • Metadata Extracted: The number of packets from which metadata has been extracted.

  • U-Plane Packet Processed: The number of U-Plane packets received.
  • GTP-U Packet Processed: The number of GTP-U packets received.

  • Metadata Extracted: The number of packets from which metadata has been extracted.

  • The statistics page displays details of deduplication activity for each device and its associated ports.

    The deduplication statics page has following fields:

    • Device: The IP address of the device processing the packets.

    • MAC Address: The MAC address of the device processing the packets.

    • Port: The interface on which the packets were received.

    • Total Received: The total number of packets received on the respective port.

    • Deduplication Drops: The number of duplicate packets dropped out of the total received packets.

    • Errors While Processing: Indicates any errors encountered during the deduplication process.

    The following image shows the deduplication statistics page

    Deduplication Statics

    Statistics

    The Statistics menu helps you perform the following:

    • Viewing Port Statistics

    • Viewing Global Statistics

    Viewing Kafka Export Statistics